CloudLinux OS Pro Components
Introduction
CloudLinux OS Shared Hosting Pro was developed with shared hosting in mind. It’s a state-of-the-art operating system that gives shared hosting providers what they need: advanced automation, deep-look performance analytics, and centralized monitoring tools.
It includes additional tools to expand the functionality.
To activate the CloudLinux OS Shared Pro you have to purchase a Shared Pro license first, or upgrade the existing one from the cln.cloudlinux.com then activate a license on a server using the same instructions just with a new key.
Info
Apart from the functionality described in this documentation section, the Shared Pro edition includes all the CloudLinux Shared OS features.
AccelerateWP
Getting started
AccelerateWP carries a suite of optimization features that can be enabled and automatically configured for the end user's site.
There are AccelerateWP, AccelerateWP Premium and AccelerateWP CDN feature suites.
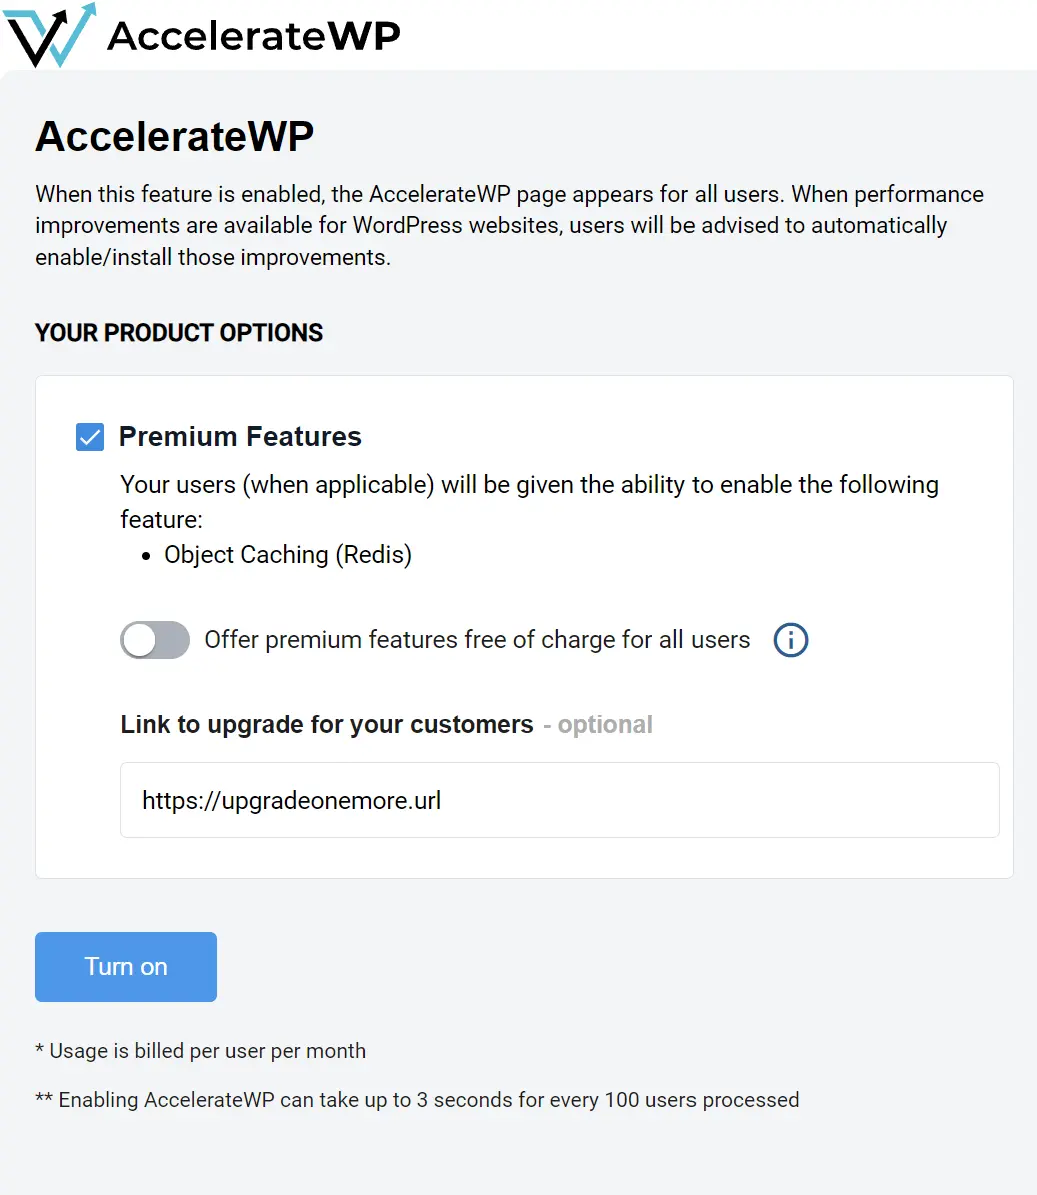
AccelerateWP suite is always enabled when AccelerateWP is turned on. Choose whether you want to offer AccelerateWP Premium offer AccelerateWP Premium or CDN (Content Delivery Network) for your users (by opting in) and click "Turn on" to start exploring AccelerateWP.
Note
AccelerateWP Free suite is enabled by default on all new servers. Proceed to suites configuration if your server has AccelerateWP already turned on.
Activate AccelerateWP for a single server
Note
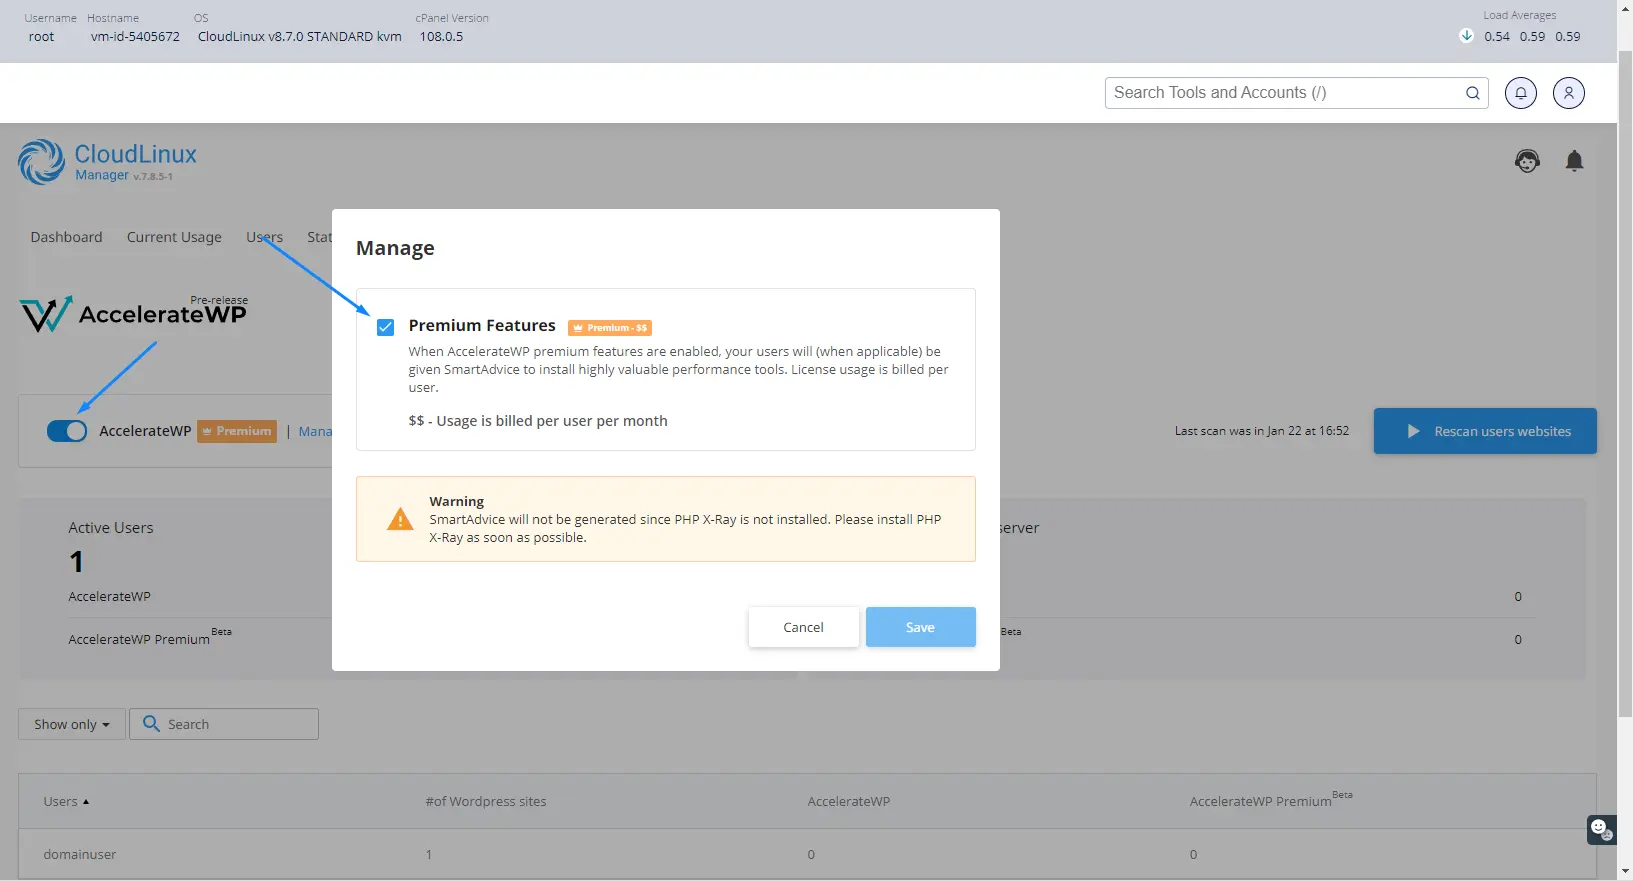
By default, AccelerateWP Premium suite includes Object Cache (which is not billable per user). If the option to allow billable optimization features is selected in CLN, the additional premium features will be included in the suite.
Enable AccelerateWP Free for all users on the server via CLI
Enable AccelerateWP Premium for all users on the server via CLI
Once the AccelerateWP suite is enabled by an administrator, end-users will see an AccelerateWP tab in their control panel interface and be able to activate the optimization feature.
When AccelerateWP CDN suite is enabled by the administrator, end-users will get 1 GB of CDN traffic and be able to activate the feature to use until the limit is reached. Once the 1GB limit is reached - the end-user will be suggested to extend the CDN limit by purchasing a CDN plan using WHMCS or 3'd party billing.
When the AccelerateWP Premium suite is enabled by the administrator, end-users will see the free Object Caching feature in their interface. If current CloudLinux license gives access to billable features - end-users will see Image Optimization and Critical CSS features as well. but cannot activate the feature unless they purchase the feature using WHMCS or 3'd party billing.
Activate AccelerateWP Free on all servers via Centralized Monitoring
It is possible to activate AccelerateWP Free on all compatible servers via the Centralized Monitoring UI or via the CLN UI. Once Activate button is clicked - AccelerateWP Free will be set up automatically on all compatible servers within couple of minutes.

Activate AccelerateWP Premium on all servers via Centralized Monitoring
Starting from lve-utils-6.5.11-1 it is possible to activate AccelerateWP Premium via Centralized Monitoring as well.
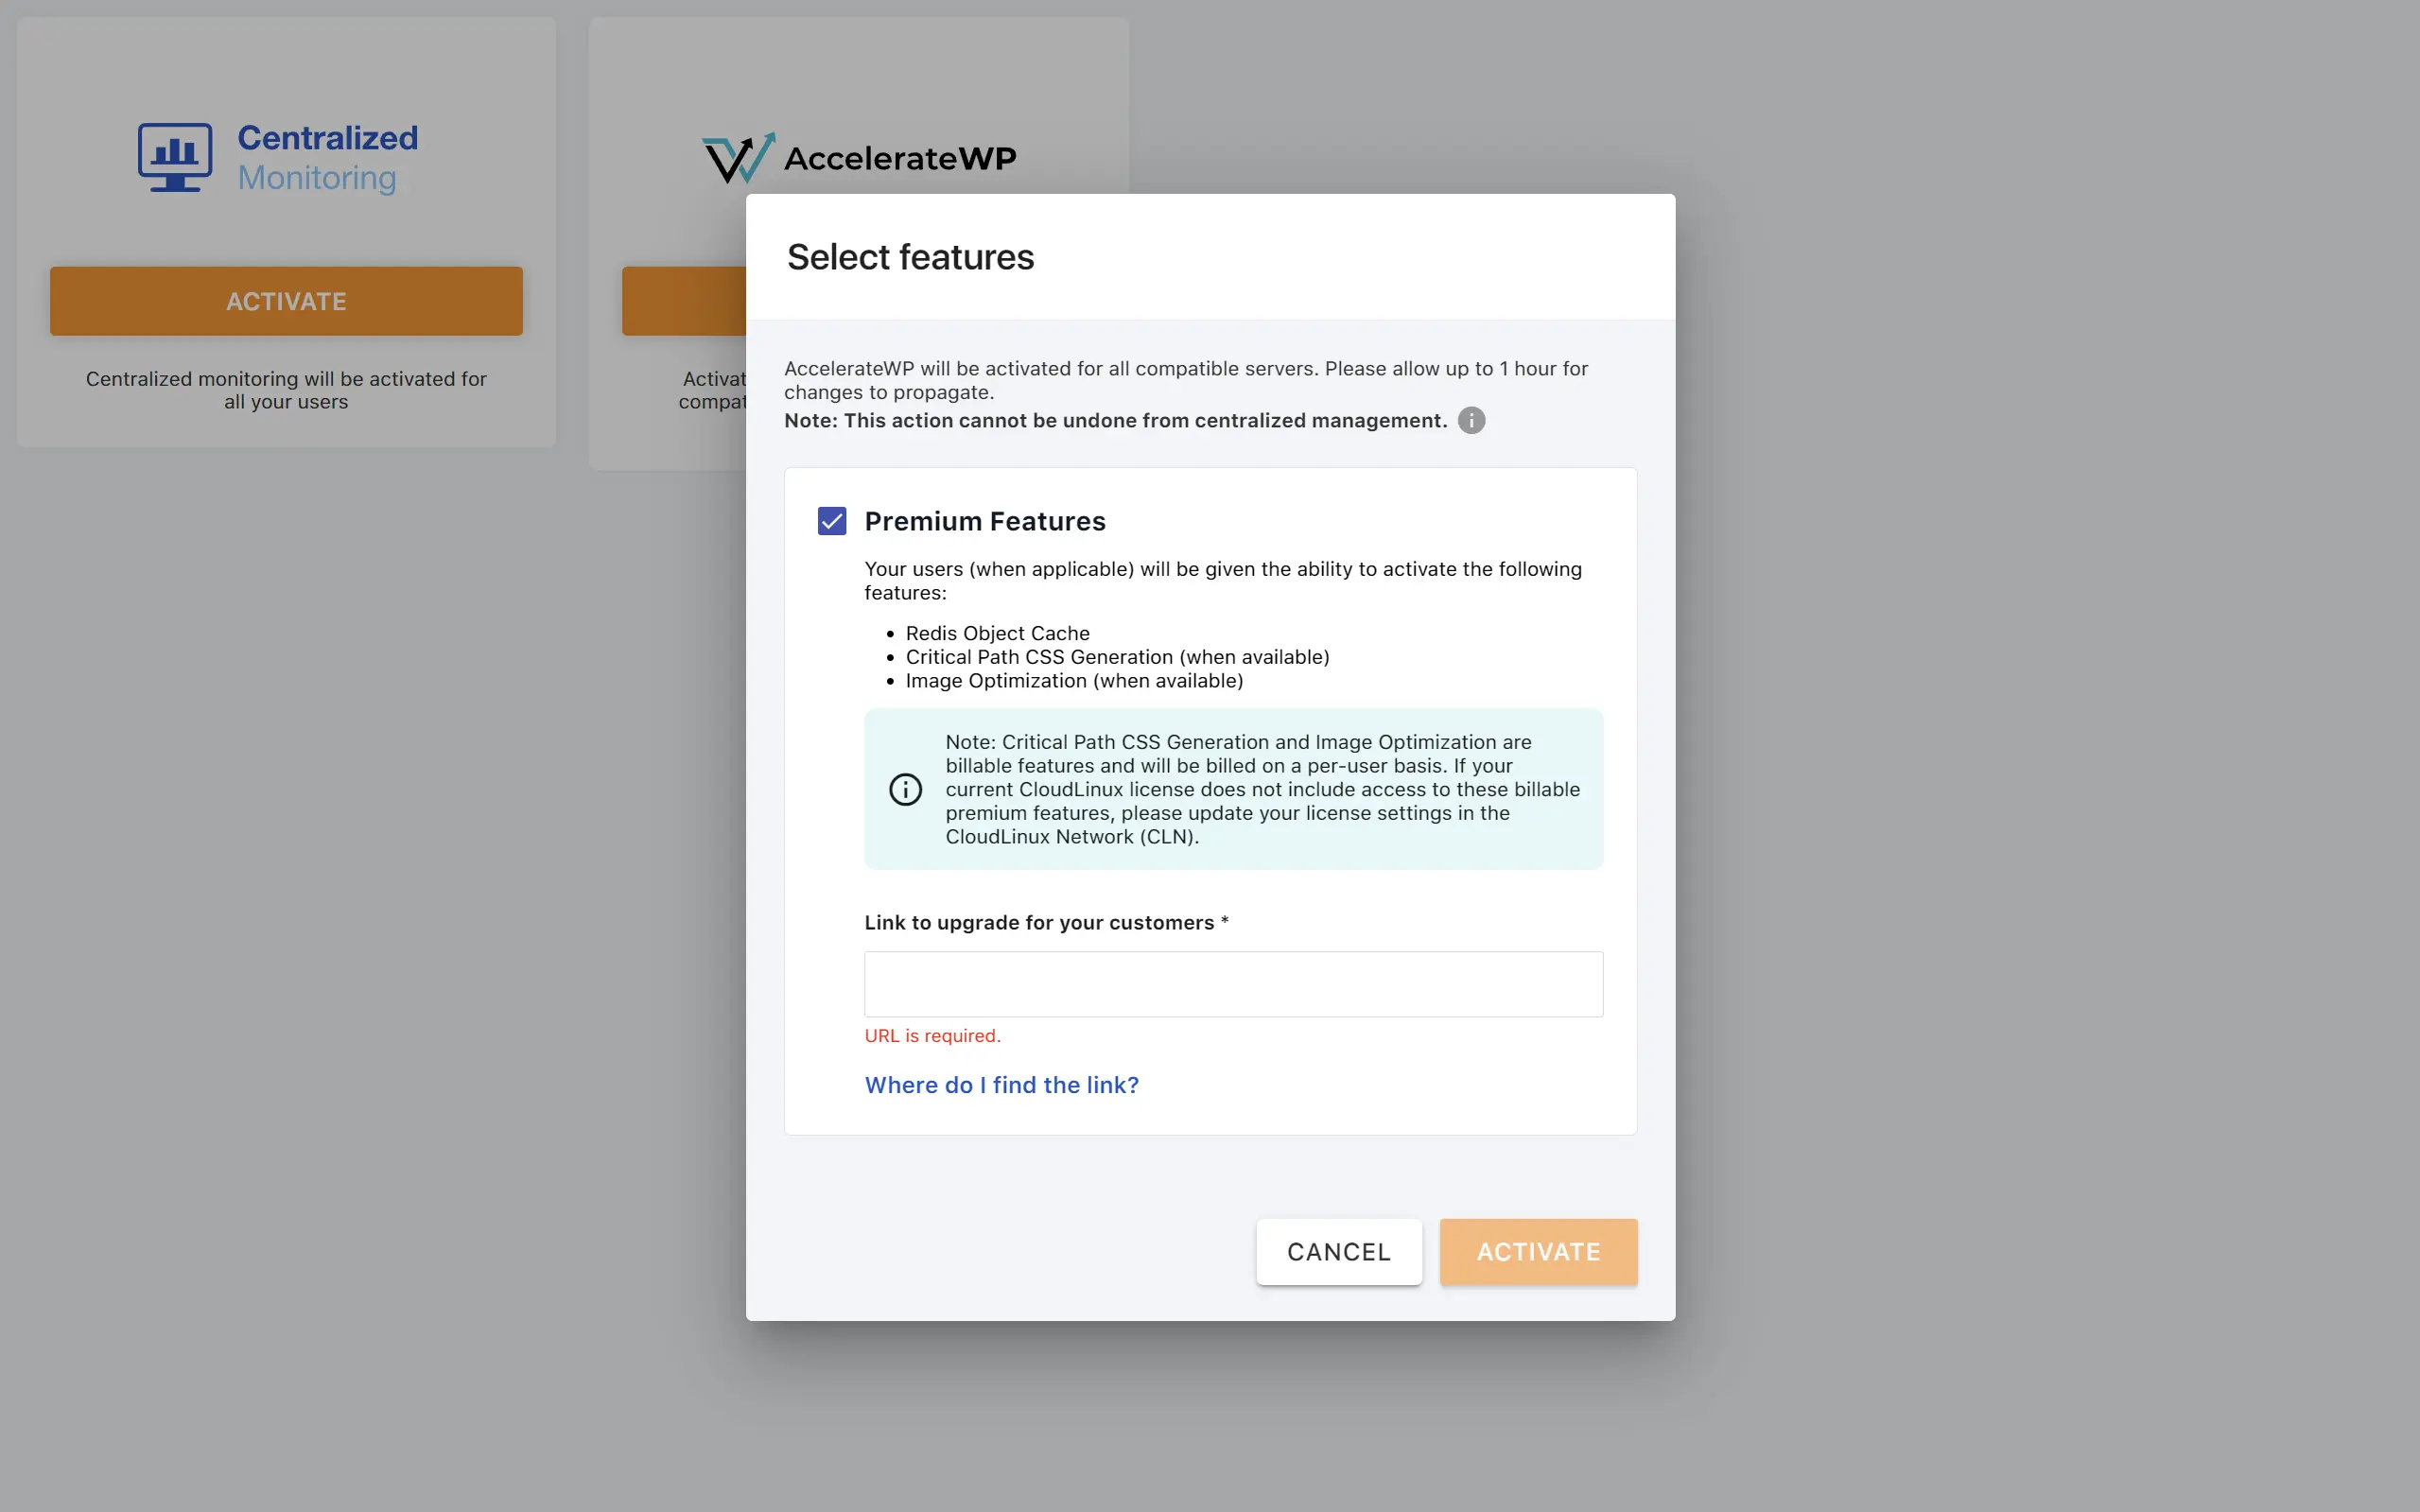
AccelerateWP Premium will be activated on all compatible servers once activation button is clicked and upgrade url is provided. Before using AccelerateWP Premium features - all end-users will be requested to upgrade to Premium plan using provided upgrade url.
Note
The list of AccelerateWP Premium features depends on current CloudLinux License, if it does not provide access to billable features (Image Optimization, Critical CSS) - only Object Cache will be available
AccelerateWP suite
This is a basic suite which includes AccelerateWP base feature: a WordPress optimization plugin that provides full page caching, GZIP compression and some other useful optimizations.
AccelerateWP suite limitations
- the website must be on an Apache or LiteSpeed web server;
- the website must be on a server with CloudLinuxOS Shared Pro, Solo, or Admin license
- the website must use PHP version 7.3 or higher.
- the WordPress version must be 5.8 and higher.
- no other WordPress Caching plugins must be installed.
- WordPress should not be running in Multisite mode.
AccelerateWP Premium suite
Starting from accelerate-wp-1.9-18 - AccelerateWP Premium suite includes both free and billable optimization features. The available features depend on the CloudLinux license installed on the server.
For more information on how to set up a CloudLinux license with AccelerateWP Premium billable features, see Setup CloudLinux license with AccelerateWP Premium billable features
Free features
- Object Caching;
Billable features
- Image Optimization;
- Critical CSS;
Once a server is licensed with CloudLinux and has paid features enabled, both free and billable features become available. If the license does not include paid features, only free features will be accessible.
The Object Caching mechanism stores database query results in additional storage for quick access. This mechanism is beneficial in cases if a website needs to process multiple pages per second as requests come in and may be helpful in cases when full-page caching cannot be used, e.g. on personalized pages.
Premium suite limitations
- the website must be on an Apache or a LiteSpeed web server;
- the website must be on a server with CloudLinuxOS Shared Pro, Solo, or Admin license
- the website must use one of the following PHP handlers:
- the website must use PHP version 7.2 or higher.
- the WordPress version must be 3.7 and higher.
- no other WordPress Caching plugins must be installed.
- the Snuffleupagus must be turned off.
- WordPress should not be running in Multisite mode.
Administrator interface
Overview
Note
Resellers' users are not allowed to use AccelerateWP features.
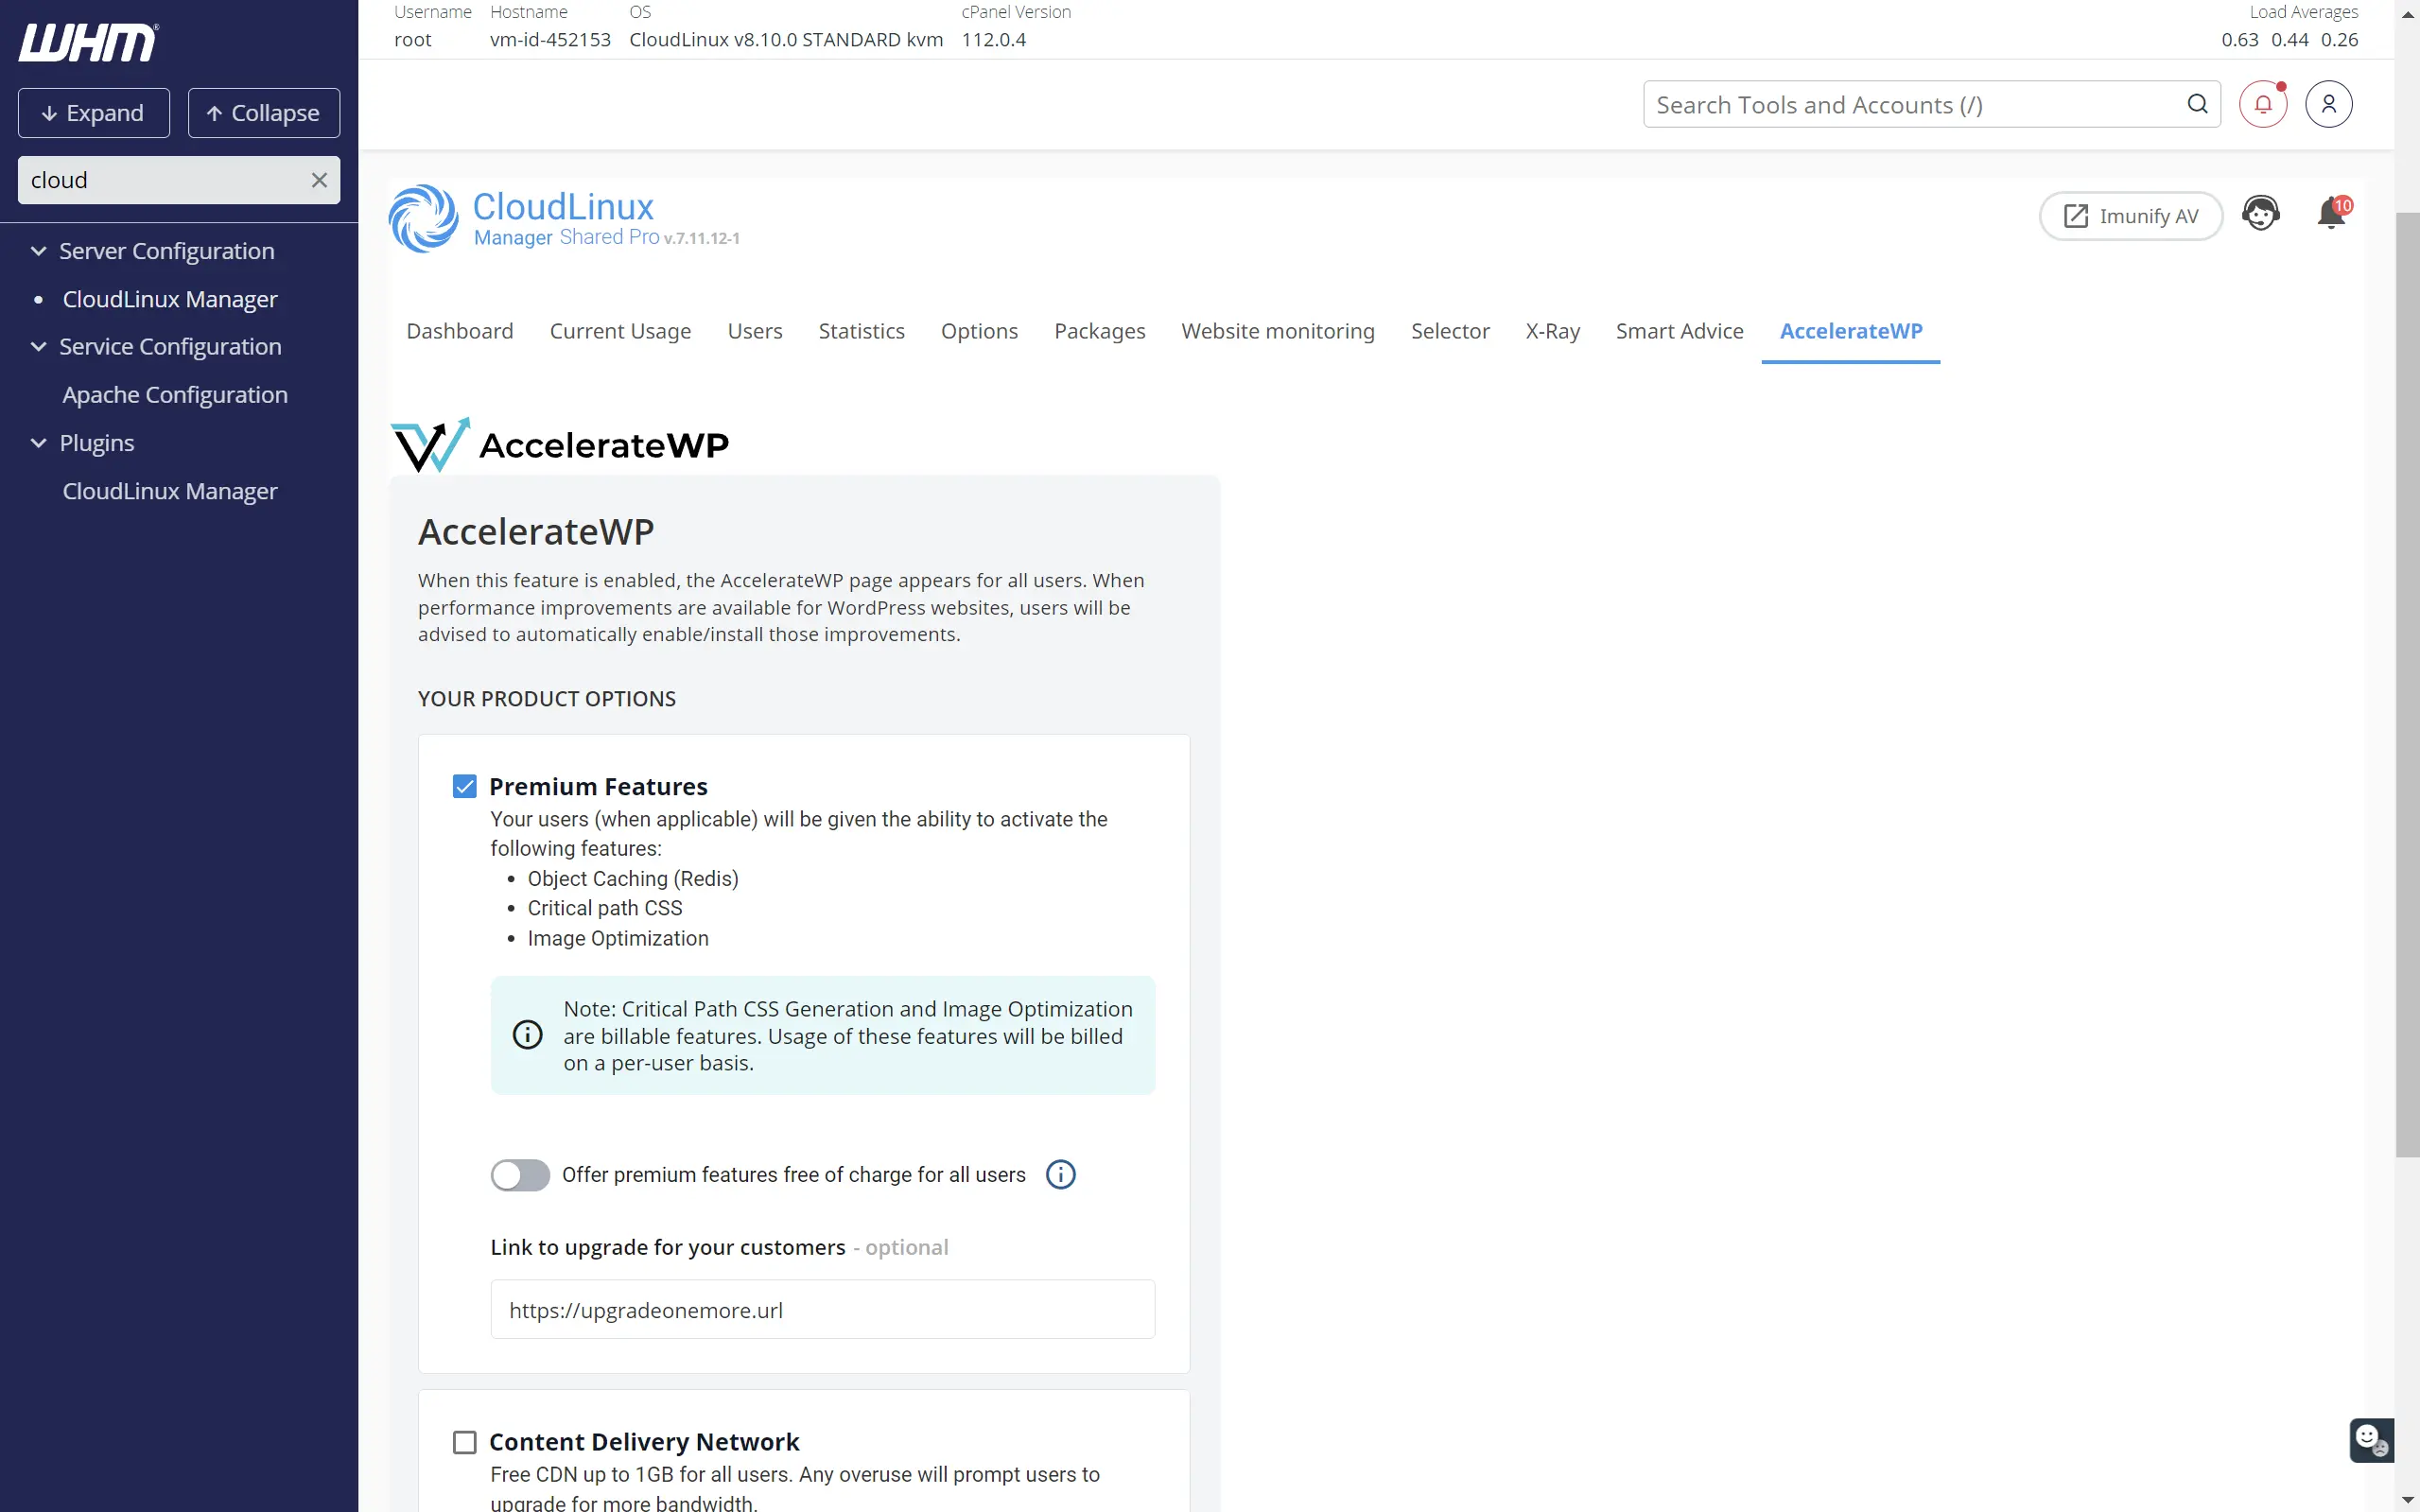
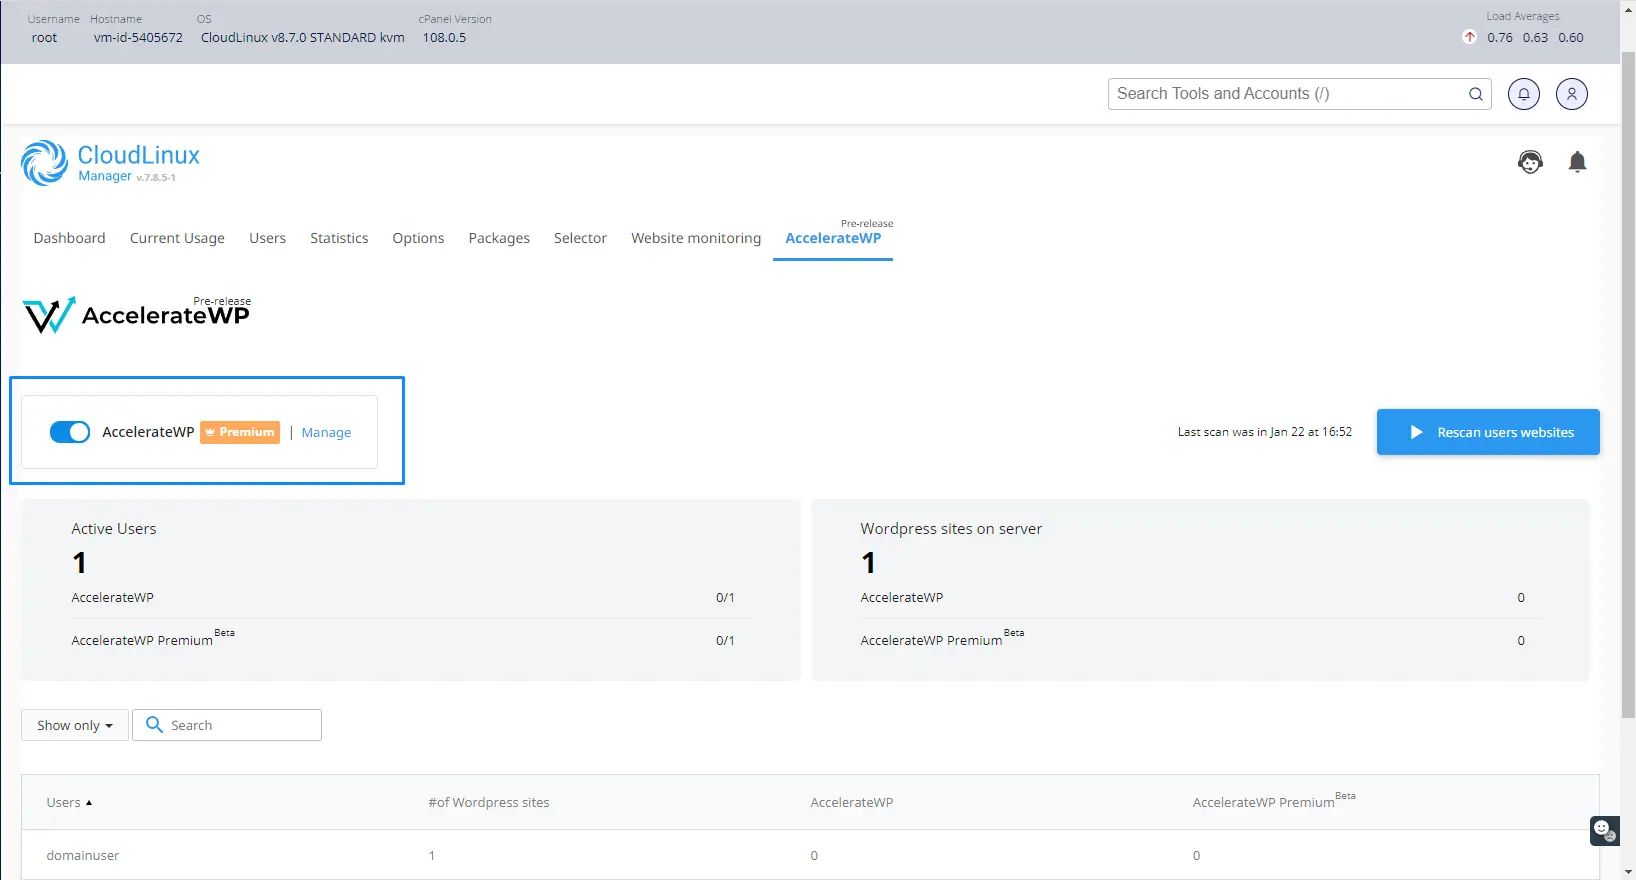
In the CloudLinux Manager → AccelerateWP tab an administrator has the opportunity to provide end-users with a suite of features, which on its turn could be activated by end-users.
Once the feature suite is enabled by the administrator, end-users will see an AccelerateWP tab in their control panel interface and be able to activate the optimization feature.
Suites usage statistics
When AccelerateWP is enabled, the AccelerateWP usage statistics are shown.
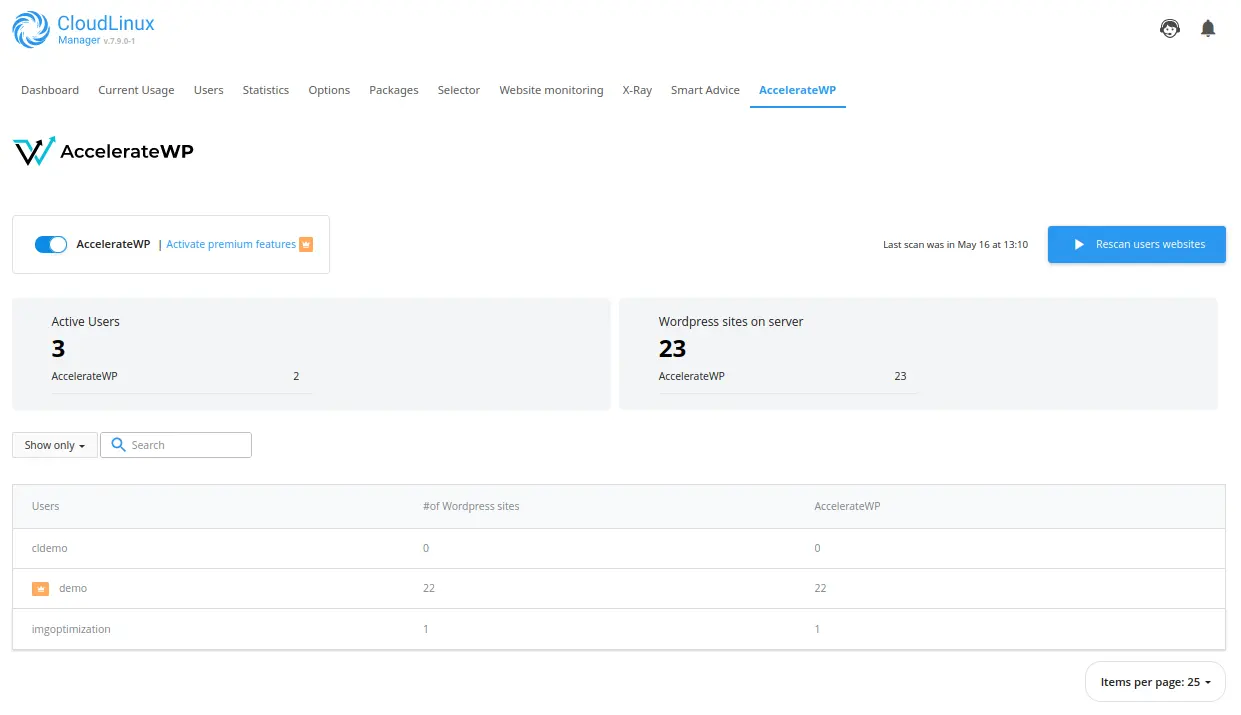
It includes:
Active Usersblock with the total number of users and number of users who have activated the optimization feature/total usersWordpress sites on serverblock with a total number of WordPress sites and WordPress sites optimized by the feature- statistics table
Each row in the statistics table represents a particular user.
The first column #of Wordpress sites shows the total number of user's WordPress sites.
The second column AccelerateWP shows a number of user's WordPress sites, optimized by the feature.
To enable premium features, click on the "Activate premium features" link and select the options you want. To integrate functions with billing, you must specify the base URL for the purchase of the function by end users.
In case both AccelerateWP and AccelerateWP Premium feature suites are enabled, the statistics are extended with AccelerateWP Premium metrics.
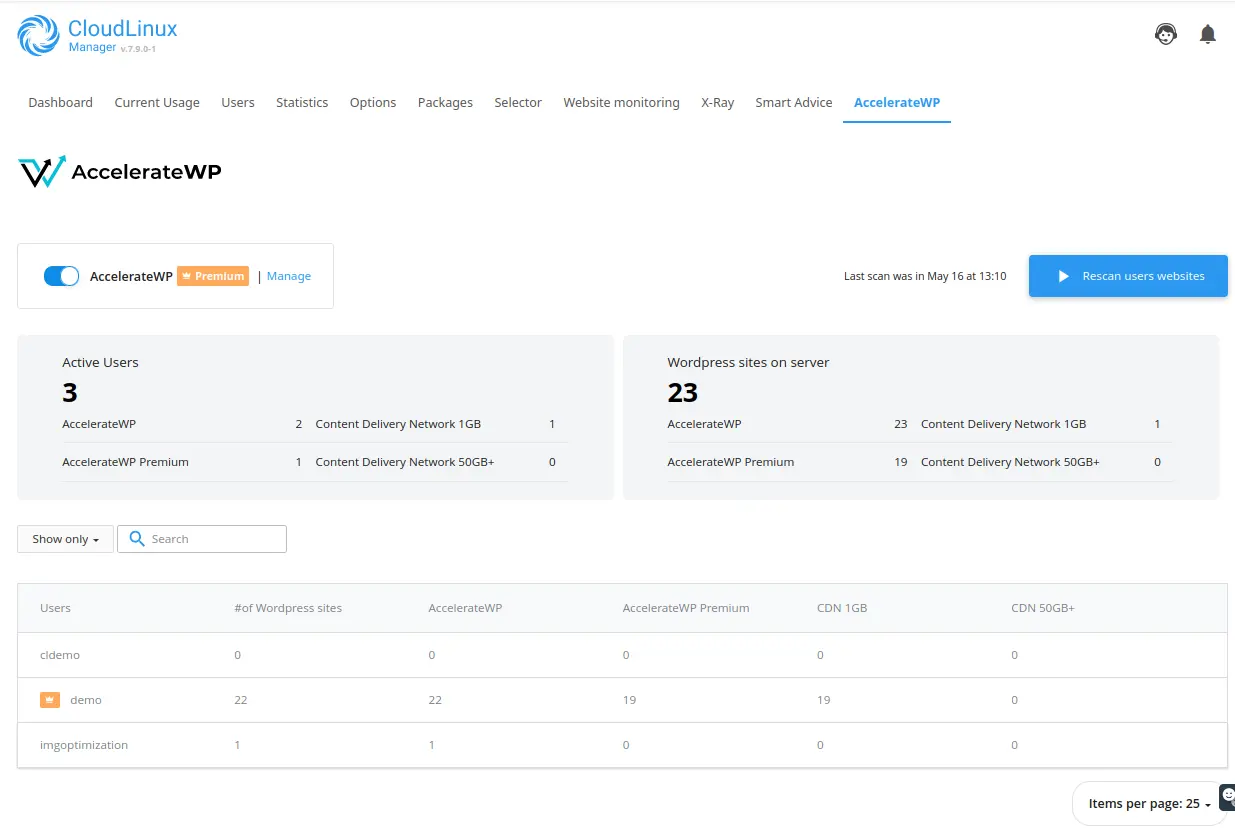
Please notice the AccelerateWP Premium rows in the Active Users and the Wordpress sites on server blocks, and also the AccelerateWP Premium column in the statistics table.
Note
Newly created users will be accounted for 10 min after adding. If you want to get updated statistics immediately, use the "Rescan users websites" button.
Filters
You may use the following filters to browse AccelerateWP statistics slices.
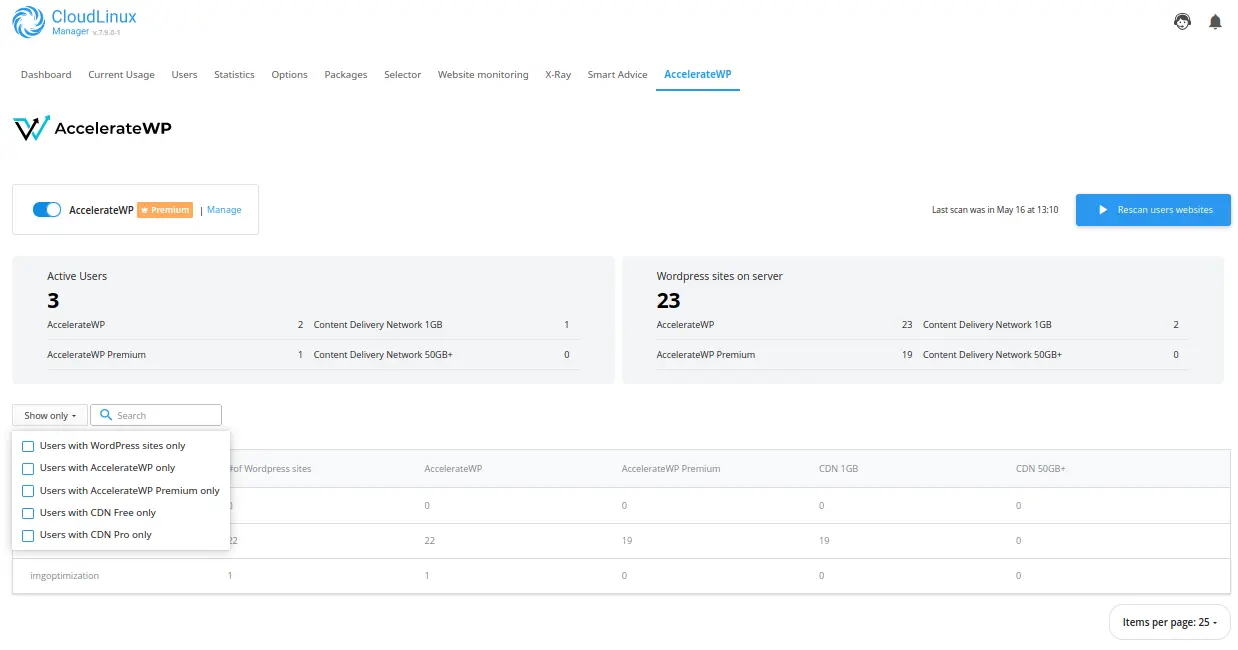
Users with WordPress sites onlyfilter will show statistics for users who already have WordPress sites; users without WordPress installations will be hiddenUsers with AccelerateWP onlyfilter will show statistics for users who utilize the AccelerateWP optimization feature; users who did not activate AccelerateWP feature will be hiddenUsers with AccelerateWP Premium onlyfilter will show statistics for users who utilize the AccelerateWP Premium (Object Caching) feature; users who did not activate the AccelerateWP Premium feature will be hiddenUsers with CDN Free onlyfilter will show statistics for users who utilize the AccelerateWP CDN featureUsers with CDN Pro onlyfilter will show statistics for users who utilize the AccelerateWP CDN Pro feature
AccelerateWP CLI
CLI commands for managing AccelerateWP are provided by those utilities:
cloudlinux-awp-admin- for administrator-side actions;cloudlinux-awp-user- for user-side actions;
Smart Advice CLI for managing optimization advices
Starting from accelerate-wp-1.6-6 AccelerateWP CLI utilities provide CLI versioning which is defined via --api-version option.
Note
It is highly recommended to specify CLI version explicitly via --api-version, otherwise CLI will rely on default settings, which cannot guarantee backward compatability.
Frequently used commands
Find all enabled premium users
Note: this can also be viewed from the AccelerateWP tab in CloudLinux Manager
cloudlinux-awp-admin get-stat
Enable AccelerateWP Free
cloudlinux-awp-admin set-suite --suites=accelerate_wp --allowed-for-all
Free CDN can only be installed based on SmartAdvice. The 1GB free CDN available only if Advice was given to the site. You can try to trace site via X-Ray, then the Advice might appear but it depends on the current rules for CDN Advice. Thus, the SmartAdvice can decide whenther CDN is not needed for some sites, therefore advice will not appear there. If there is no Advice, it means that that site does not need that type of optimization.
SmartAdvice may determine that certain websites don't require CDN resulting in the absence of Advice for you. If no Advice is provided, it indicates that the particular site doesn't necessitate that specific optimization.
Enable AccelerateWP Premium
cloudlinux-awp-admin set-suite --suites=accelerate_wp_premium --visible-for-all
Enable AccelerateWP Premium for free for all users:
cloudlinux-awp-admin set-suite --suites=accelerate_wp_premium --allowed-for-all
Set Premium Upgrade URL
cloudlinux-awp-admin set-options --upgrade-url "https://plan.upgrade/splash"
Enable AccelerateWP CDN free
All users
cloudlinux-awp-admin set-suite --suites accelerate_wp_cdn --allowed-for-all
Single user or group of users
cloudlinux-awp-admin set-suite --suites=accelerate_wp_cdn --allowed --users=<username1>,<username2>
Enable AccelerateWP CDN 50GB (example)
Important note: each of these users will become billable to you as soon as you grant this entitlement
All users
cloudlinux-awp-admin set-suite --suites accelerate_wp_cdn_pro --attrs='{"traffic_limit": "50 GB"}' --allowed-for-all
Single user or group of users
cloudlinux-awp-admin set-suite --suites accelerate_wp_cdn_pro --attrs='{"traffic_limit": "50 GB"}' --allowed --users <username>,<username2>
Revoke access to CDN
All users
cloudlinux-awp-admin set-suite --suites accelerate_wp_cdn_pro --disallowed-for-all
Single user or group of users
cloudlinux-awp-admin set-suite --suites accelerate_wp_cdn_pro --disallowed --users <username>,<username2>
Set Upgrade URL for CDN
cloudlinux-awp-admin set-options --suite accelerate_wp_cdn_pro --upgrade-url="https://plan.upgrade/cdn-boost"
Grant users access to ALL premium features
Note - this is the most common and fundamentally the same as the users upgrading using the WHMCS plugin - you will only be billed for the users that activate at least one premium feature
All users
cloudlinux-awp-admin set-suite --suites=accelerate_wp_premium --allowed-for-all
Single user or group of users
cloudlinux-awp-admin set-suite --suites=accelerate_wp_premium --allowed --users=<username1>,<username2>
Completely disallow access to premium features (including premium SmartAdvice)
All users
cloudlinux-awp-admin set-suite --suites=accelerate_wp_premium --disallowed-for-all
Single user or group of users
cloudlinux-awp-admin set-suite --suites=accelerate_wp_premium --disallowed --users=<username1>,<username2>
Enable all features
Use the cloudlinux-awp-admin enable-feature CLI command to ensure the best performance for every WordPress user. This CLI command scans the server for all WordPress sites, then activates the AccelerateWP feature suite. Activation is skipped for any sites with existing page caching or feature incompatibilities. Note: Please make sure your AccelerateWP version is >= 1.2-2 before proceeding. Scan the server in background mode and activate AccelerateWP on those WordPress sites where it is possible:
cloudlinux-awp-admin enable-feature --all
Check feature activation status
cloudlinux-awp-admin enable-feature --status
cloudlinux-awp-admin
cloudlinux-awp-admin --api-version <api_version> <command>
supported commands for --api-version 1:
set-suite- manage optimization suites;set-options- manage server wide settings;get-report- get per user information about optimization suites statuses (allowed/disallowed) and usage of specific suites;generate-report- generate information, that is obtained viaget-reportcommand;get-stat- get total information about suites statuses (allowed/disallowed/visible) and usage of optimization features;enable-feature- activate free AccelerateWP feature to all users on the server;object-cache-banner- manage Redis Object Cache Pro banner visibility in WordPress (hide or show banner for specific WordPress site);
All CLI responses contain result field which says was call successful or not.
{"result": "success"}- in case of successful call{"result": "ERROR_STRING"}- in case of unsuccessful call,resultcontains string with error details. Response also could havecontextfield to provide additional error info, e.g: username, optimization suite or feature, etc. Example:
{
    "context": {
        "suite": "accelerate_wp_cdn"
    },
    "result": "Suite %(suite)s is not visible for users and so cannot be allowed in billing. Activate the suite on server first. Contact your hoster if you don`t have an access to the server.",
    "timestamp": 1691136964.3719108
}
Manage AccelerateWP optimization suites
--api-version 1
supported suites:
accelerate_wp- AccelerateWP Free features;accelerate_wp_premium- AccelerateWP Premium features;accelerate_wp_cdn- AccelerateWP CDN 1 GB;accelerate_wp_cdn_pro- AccelerateWP CDN Pro (50GB by default);
supported actions for specific user(s):
--allowed- make features of optimization suite ALLOWED to be activated by end-user;--disallowed- make features optimization suite DISALLOWED to be activated by end-user;
cloudlinux-awp-admin --api-version 1 set-suite --suites=<suites_comma_separated> --users=<usernames_comma_separated> (--allowed | --disallowed) [--attrs=<json_string>]
Examples of CLI commands to disable undesired optimization suite(s) for a single user.
To disable the AccelerateWP suite:
cloudlinux-awp-admin --api-version 1 set-suite --suites=accelerate_wp --disallowed --users=<username>
To disable the AccelerateWP Premium suite:
cloudlinux-awp-admin --api-version 1 set-suite --suites=accelerate_wp_premium --disallowed --users=<username>
To disable the AccelerateWP CDN suite:
cloudlinux-awp-admin --api-version 1 set-suite --suite=accelerate_wp_cdn --disallowed --users=<username>
To disable the AccelerateWP CDN Pro suite:
cloudlinux-awp-admin --api-version 1 set-suite --suite=accelerate_wp_cdn_pro --disallowed --users=<username>
To enable CDN Pro for a particular user:
cloudlinux-awp-admin --api-version 1 set-suite --suites accelerate_wp_cdn_pro --allowed --users=<username>
To disable all suites:
cloudlinux-awp-admin --api-version 1 set-suite --suites=accelerate_wp,accelerate_wp_premium,accelerate_wp_cdn,accelerate_wp_cdn_pro --disallowed --users=<username>
To define CDN traffic limit for AccelerateWP CDN Pro optimization suite (50GB limit is by default):
cloudlinux-awp-admin --api-version 1 set-suite --suites accelerate_wp_cdn_pro --allowed --users username1 --attrs='{"traffic_limit": "100 GB"}'
supported traffic limits:
50 GB- default traffic limit, if no--attrspassed onset-suite;100 GB250 GB500 GB1 TB2.5 TB5 TB10 TB
For all users on the server:
Supported actions for all users:
--allowed-for-all- make features of optimization suite ALLOWED to be activated for all end-users (and newly created);--disallowed-for-all- make features optimization suite DISALLOWED to be activated for all end-users (and newly created);--visible-for-all- make features of optimization suite VISIBLE for all end-users (and newly created);
cloudlinux-awp-admin --api-version 1 set-suite --suites=<suites_comma_separated> (--allowed-for-all | --disallowed-for-all | --visible-for-all)
Example of command to enable CDN Pro for all users:
cloudlinux-awp-admin --api-version 1 set-suite --suites accelerate_wp_cdn_pro --users all --allowed-for-all
Manage AccelerateWP server wide settings
cloudlinux-awp-admin --api-version <api_version> set-options
--api-version 1
cloudlinux-awp-admin --api-version 1 set-options (--icon-visible=<on/off>) | (--object-cache-banner-visible=<on/off>) | (--suite="feature_suite" --upgrade-url="link_to_url") | (--features="optimization_features_comma_separated" --feature-visible=<on/off>)
To make AccelerateWP icon visible or invisible in end-user UI:
cloudlinux-awp-admin --api-version 1 set-options --icon-visible=on
cloudlinux-awp-admin --api-version 1 set-options --icon-visible=off
To change the display of promotional materials for all new installations of the Redis Object Cache module by default, you need to set the visibility setting
cloudlinux-awp-admin --api-version 1 set-options --object-cache-banner-visible=on
cloudlinux-awp-admin --api-version 1 set-options --object-cache-banner-visible=off
To make specific AccelerateWP feature visible or invisible to all users:
Note
Added in accelerate-wp >= 1.6-6
supported features:
critical_cssimage_optimizationobject_cachecdn
cloudlinux-awp-admin --api-version 1 set-options --feature-visible=on --features="<features_comma_separated>"
cloudlinux-awp-admin --api-version 1 set-options --feature-visible=off --features="<features_comma_separated>"
To set subscription upgrade url for specific AccelerateWP optimization suite:
for AccelerateWP Premium
cloudlinux-awp-admin --api-version 1 set-options --suite accelerate_wp_premium --upgrade-url="http://mybilling1.com"
for AccelerateWP CDN Pro
cloudlinux-awp-admin --api-version 1 set-options --suite accelerate_wp_cdn_pro --upgrade-url="http://mybilling2.com"
Generate AccelerateWP suites report for all users on server
--api-version 1
cloudlinux-awp-admin --api-version <api_version> generate-report (--all | --status)
Start report generation:
cloudlinux-awp-admin --api-version 1 generate-report --all
It starts data collection in background, so check status of generation by separate command:
cloudlinux-awp-admin --api-version 1 generate-report --status
Rely on scan_status key to ensure scanning is over, for example if it is still in progress:
 {
    "last_scan_time": 1690198116,
    "result": "success",
    "scan_status": "in_progress",
    "timestamp": 1690199148.6370175,
    "total_users_scanned": 0,
    "total_users_to_scan": 1
}
AccelerateWP suites statistics
--api-version 1
cloudlinux-awp-admin --api-version <api_version> get-report (--all | --users=<usernames_comma_separated>)
Get suites statistics for all users:
cloudlinux-awp-admin --api-version 1 get-report --all
or for a particular user:
cloudlinux-awp-admin --api-version 1 get-report --users=<username>
This CLI command returns the following information:
- total number of users in the report --
total_users_count - total number of websites in the report --
total_wordpress_count - total number of users with particular suite enabled --
total_users_count_active - total number of websites with particular suite enabled --
total_sites_count_active - number of websites with a particular suite enabled per each user in the report --
*_sites_countin theuserslist - suites visibility status per each user in the report --
suitesin theuserslist- possible values for visibility status are:
visible,allowed,disabled
- possible values for visibility status are:
The example output for a single user is given below:
{
    "last_scan_time": 1681198804,
    "result": "success",
    "timestamp": 1681203383.3503218,
    "total_sites_count_active": {
        "accelerate_wp": 1,
        "accelerate_wp_premium": 0
    },
    "total_users_count": 1,
    "total_users_count_active": {
        "accelerate_wp": 1,
        "accelerate_wp_premium": 0
    },
    "total_wordpress_count": 2,
    "users": [
        {
            "accelerate_wp_active_sites_count": 1,
            "accelerate_wp_premium_sites_count": 0,
            "suites": {
                "accelerate_wp": {
                    "source": "manual",
                    "status": "allowed"
                },
                "accelerate_wp_premium": {
                    "source": "default",
                    "status": "visible"
                }
            },
            "username": "user16",
            "wp_sites_count": 2
        }
    ]
}
AccelerateWP features statistics
Get overall AccelerateWP features usage statistics for a server with:
--api-version 1
cloudlinux-awp-admin --api-version 1 get-stat
This CLI command returns the following information:
- number of
allowed_usersintotaland per feature - number of
visible_usersintotaland per feature - number of
allowed_suitesper suite - number of sites with enabled features in
totaland per feature --enabled_sites - number of users with visible features in
totaland per feature --visible_users - features which are currently allowed --
features_allowed_by_default - features which are currently visible --
features_visible_by_default
The example output is given below:
{
    "accelerate_wp_suite_enabled_premium_suite_disallowed": 0,
    "accelerate_wp_suite_enabled_premium_suite_visible": 0,
    "allowed_suites": {
        "accelerate_wp": 1,
        "accelerate_wp_cdn_free": 1,
        "accelerate_wp_cdn_pro": 0,
        "accelerate_wp_premium": 1
    },
    "allowed_users": {
        "cdn_free": 1,
        "cdn_pro": 0,
        "critical_css": 1,
        "image_optimization": 1,
        "object_cache": 1,
        "site_optimization": 1,
        "total": 1
    },
    "enabled_sites": {
        "cdn_free": 0,
        "cdn_pro": 0,
        "critical_css": 1,
        "image_optimization": 0,
        "object_cache": 0,
        "site_optimization": 0,
        "total": 1
    },
    "enabled_suites": {
        "accelerate_wp": 0,
        "accelerate_wp_cdn_free": 0,
        "accelerate_wp_cdn_pro": 0,
        "accelerate_wp_premium": 1
    },
    "enabled_users": {
        "cdn_free": 0,
        "cdn_pro": 0,
        "critical_css": 1,
        "image_optimization": 0,
        "object_cache": 0,
        "site_optimization": 0
    },
    "features_allowed_by_default": [
        "cdn",
        "critical_css",
        "image_optimization",
        "object_cache",
        "site_optimization"
    ],
    "features_visible_by_default": [
        "cdn",
        "critical_css",
        "image_optimization",
        "object_cache",
        "site_optimization"
    ],
    "is_accelerate_wp_flag_enabled": false,
    "is_accelerate_wp_icon_enabled": true,
    "result": "success",
    "timestamp": 1690979440.5282295,
    "upgrade_urls": {
        "accelerate_wp_cdn_pro": null,
        "accelerate_wp_premium": null
    },
    "visible_users": {
        "cdn_free": 1,
        "cdn_pro": 0,
        "critical_css": 1,
        "image_optimization": 1,
        "object_cache": 1,
        "site_optimization": 1,
        "total": 1
    }
}
Activate free AccelerateWP for all WordPress sites on the server
--api-version 1:
cloudlinux-awp-admin --api-version 1 enable-feature (--all | --status)
Use the that command to ensure the best performance for every end-user. CLI command scans a server for all WordPress sites and activates the AccelerateWP free feature suite. It can take up to 2 minutes for a single site. CLI command skips activation for WordPress sites with page caching or feature incompatibilities.
Note
Please make sure your AccelerateWP version is >= 1.2-2 before proceeding.
Scan the server in background mode and activate free AccelerateWP plugin on those WordPress sites where it is possible:
cloudlinux-awp-admin --api-version 1 enable-feature --all
The output will state the number of users for the scan and the progress state of the process.
Check activation status:
cloudlinux-awp-admin --api-version 1 enable-feature --status
The output will be either:
- Activation is still in progress,
- Activation is done. The message will state how many users were initially for the scan, a number of WordPress sites with successfully activated suite and the total number of WordPress sites scanned.
AccelerateWP disable Redis Object Cache Pro banner
--api-version 1
cloudlinux-awp-admin --api-version 1 object-cache-banner (--enable | --disable) (--all | --users=<usernames_comma_separated>)
Depending on the server settings, the WP_REDIS_DISABLE_BANNERS constant will be defined in the wp-config.php file when the module is activated, which affects the display of promotional materials.
To change the WP_REDIS_DISABLE_BANNERS constant for previously installed modules, you need to run a process to update the constant:
Hide on websites where the module is installed
- for all users:
cloudlinux-awp-admin --api-version 1 object-cache-banner --all --disable - for specific users (users separated by commas):
cloudlinux-awp-admin --api-version 1 object-cache-banner --users foo,bar --disable - for current user (run under the user):
cloudlinux-awp-user --api-version 1 object-cache-banner --all --disable - for a specific website (run under the user):
cloudlinux-awp-user --api-version 1 object-cache-banner --wp-path "" --domain "demo.com" --disable
Display on websites where the module is installed
- for all users:
cloudlinux-awp-admin --api-version 1 object-cache-banner --all --enable - for specific users (users separated by commas):
cloudlinux-awp-admin --api-version 1 object-cache-banner --users foo,bar --enable - for current user (run under the user):
cloudlinux-awp-user --api-version 1 object-cache-banner --all --enable - for a specific website (run under the user):
cloudlinux-awp-user --api-version 1 object-cache-banner --wp-path "" --domain "demo.com" --enable
If the banner was previously disabled/enabled for the user/website, then for its subsequent activation of the ObjectCache module, the general settings at the server level will be applied. This means that for each user/website we do not store an individual banner disable/enable setting.
SmartAdvice email reminders
This section outlines the process of managing email notifications from the SmartAdvice plugins. It applies to all users and it is a global (server-wide) setting.
Sending reminder notifications for not activated advices once a month:
cloudlinux-awp-admin --api-version 1 set-options --smart-advice-reminders=<on/off>
cloudlinux-awp-user
cloudlinux-awp-user --api-version=<api_version> <command>
supported commands:
enable- activate specific optimization feature on WordPress site;disable- deactivate specific optimization feature on WordPress site;get- get information of optimization features on all user`s WordPress sites;
Use the following CLI command on behalf of a user
All CLI responses contain result field which says was call successful or not.
{"result": "success"}- in case of successful call{"result": "ERROR_STRING"}- in case of unsuccessful call,resultcontains string with error details
Enable optimization feature
--api-version 1
supported features:
accelerate_wpobject_cachecritical_cssimage_optimization
cloudlinux-awp-user --api-version 1 enable --feature <feature> --wp-path <path_to_wordpress> --domain <user_domain> [--ignore-errors]
Use --ignore-errors to ignore WordPress site web-checks after enabling optimization features.
example of enabling Object Caching feature
cloudlinux-awp-user --api-version 1 enable --feature object_cache --wp-path "userwordpresssite" --domain username1.com
Please, make sure --wp-path is same as in "path" key of cloudlinux-awp-user get json output.
Successful response example of enabling feature: rely on feature.enabled field to identify that feature was enabled
{
    "feature": {
        "enabled": true
    },
    "result": "success",
    "timestamp": 1690975273.8860605
}
Disable optimization feature
--api-version 1
supported features:
accelerate_wpobject_cachecritical_cssimage_optimization
cloudlinux-awp-user --api-version 1 disable --feature <feature> --wp-path <path_to_wordpress> --domain <user_domain>
example of disabling Object Caching feature
cloudlinux-awp-user --api-version 1 disable --feature object_cache --wp-path "userwordpresssite" --domain username1.com
Please, make sure --wp-path is same as in "path" key of cloudlinux-awp-user get json output.
Successful response example of enabling feature: rely on feature.enabled field to identify that feature was enabled
{
    "feature": {
        "enabled": true,
        "visible": true
    },
    "result": "success",
    "timestamp": 1690975273.8860605
}
AccelerateWP features detailed statistics
--api-version 1
cloudlinux-awp-user --api-version 1 get
The command reports:
- features allowed for a user --
allowed_features - all user's websites
docrootswith features information per eachwps, which includes:- status of each feature -- if the feature is
enabled, if the feature isvisible - issues detected (if any) for each feature
- status of each feature -- if the feature is
- subscription status (for premium features) --
subscription - features visible for a user --
visible_features
The example output is given below:
{
    "allowed_features": {
        "accelerate_wp": [],
        "accelerate_wp_premium": []
    },
    "docroots": [
        {
            "domains": [
                "user0.com"
            ],
            "php_handler": "fastcgi",
            "php_version": "plesk-php73-fastcgi",
            "wps": [
                {
                    "features": {
                        "accelerate_wp": {
                            "enabled": false,
                            "issues": [
                                {
                                    "context": {
                                        "plugins": "WP Rocket"
                                    },
                                    "description": "Found conflicting plugins: %(plugins)s.",
                                    "fix_tip": "Deactivate and uninstall the conflicting plugin using the WordPress administration interface.",
                                    "header": "Conflicting plugins are enabled",
                                    "type": "incompatibility"
                                }
                            ],
                            "visible": true
                        },
                        "object_cache": {
                            "enabled": false,
                            "issues": [
                                {
                                    "context": {
                                        "blog_url": "https://blog.cloudlinux.com/",
                                        "supported_handlers": "php-fpm, lsapi"
                                    },
                                    "description": "Website uses unsupported PHP handler. Currently supported handler(s): %(supported_handlers)s.",
                                    "fix_tip": "Please, set or ask your system administrator to set one of the supported PHP handlers for the domain: %(supported_handlers)s. Or keep watching our blog: %(blog_url)s for supported handlers list updates.",
                                    "header": "Unsupported PHP handler",
                                    "type": "incompatibility"
                                }
                            ],
                            "visible": true
                        }
                    },
                    "path": "wordpress",
                    "version": "6.2"
                }
            ]
        },
        {
            "domains": [
                "sub.user0.com"
            ],
            "php_handler": "fastcgi",
            "php_version": "plesk-php73-fastcgi",
            "wps": []
        }
    ],
    "max_cache_memory": "64mb",
    "result": "success",
    "subscription": {
        "object_cache": "no"
    },
    "timestamp": 1681200081.765476,
    "upgrade_url": null,
    "used_memory": null,
    "visible_features": {
        "accelerate_wp": [
            "accelerate_wp"
        ],
        "accelerate_wp_premium": [
            "object_cache"
        ]
    }
}
Configure redis extension for alt-php
Object cache optimization feature requires several php extensions to be enabled, so there is a script /usr/share/cloudlinux/wpos/enable_redis_for_alt_php.py which does configuration of required modules: redis, igbinary, json.
By default, it modifies global php.ini and enables required extensions there.
Starting from accelerate-wp >= 1.6-7 - to prevent this script of modifying global php.ini - create marker file: /var/clwpos/admin/do_not_modify_global_php.flag. In that case, additional custom php ini with required php extension will be created and global php.ini remains unmodified.
Billing Integration (upsell automation for premium features)
The premium features of AccelerateWP are intended to generate revenue for CloudLinux hosting customers by adding high-end performance value to WordPress that meets or exceeds the value of premium WordPress Hosting/Managed WordPress market leaders. AccelerateWP premium features are suggested to hosting end-users (and WordPress administrators) when substantial data supports a significant performance boost will be achived upon activation.
Setting the upgrade URL
When a premium feature is suggested to the user/admin through our SmartAdvice utility, they will be prompted to upgrade. The upgrade URL is where the user will be sent when they click "upgrade" and this is customizable per server (or fleet). There are 2 common upgrade packaging models that will dictate how this URL is set and you will need to make this decision and configure the upgrade URL before offering AccelerateWP premium. The 2 packaging models are:
- Include AccelerateWP Premium features in your highest tier hosting plans
- Offer as an add-on subscription to existing hosting plans
Once you have made this decision, you will need to integrate your billing platform.
WHMCS billing
If you use WHMCS, AccelerateWP Premium billing integration is quite simple. CloudLinux developed its own WHMCS plugin which provides this out of the box. View our documentation to learn how to install and use the plugin.
Other billing integration
As AccelerateWP Premium is a feature that works on a subscription basis, we made it possible for hosters to integrate their existing billing systems with our plugin and sell the feature for their users.
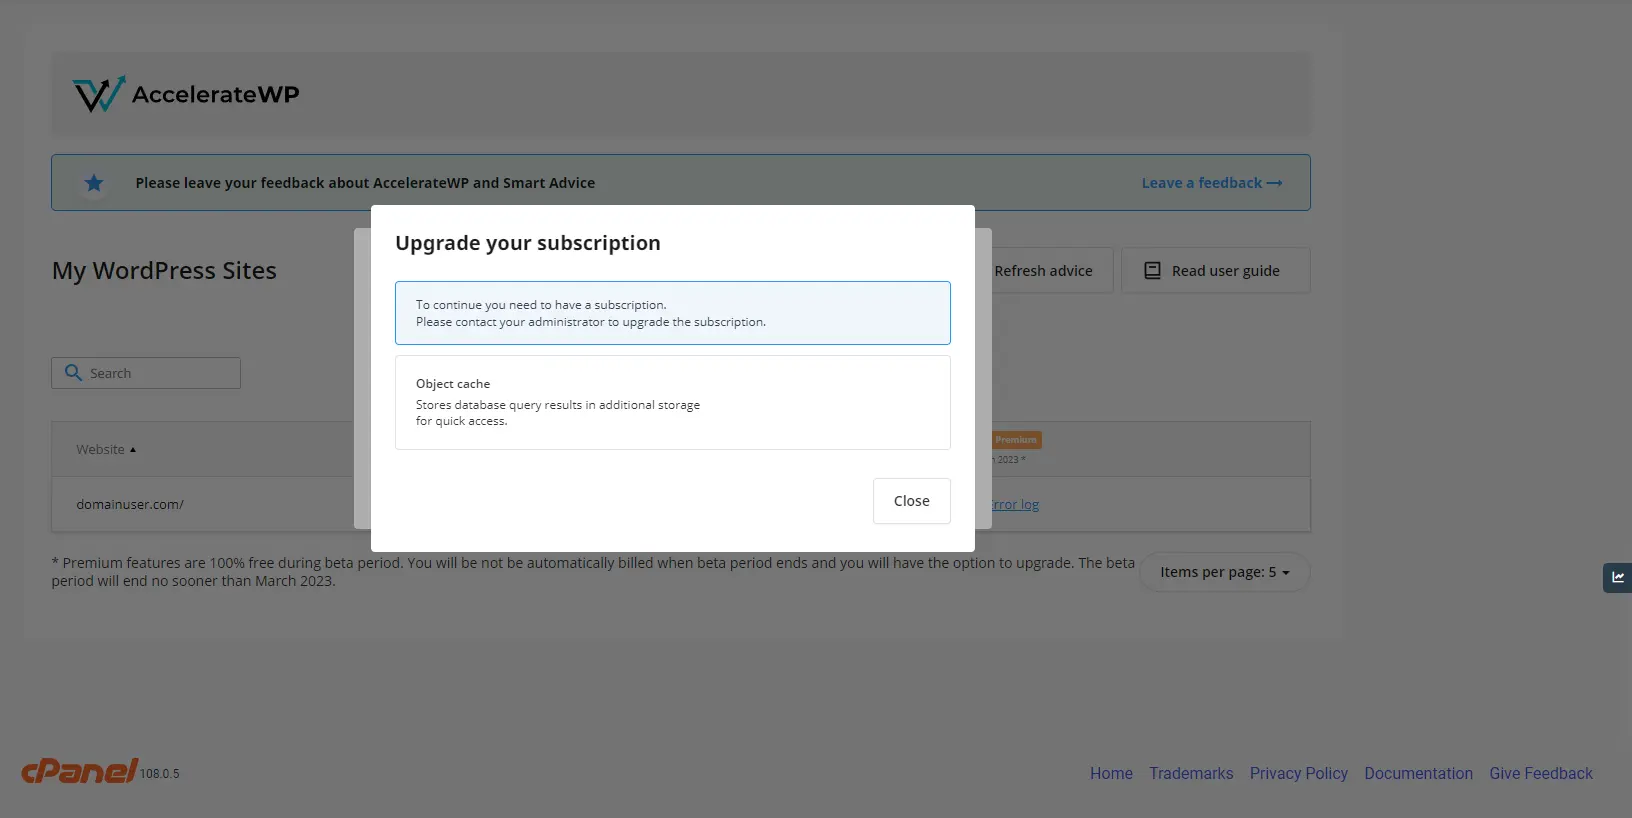
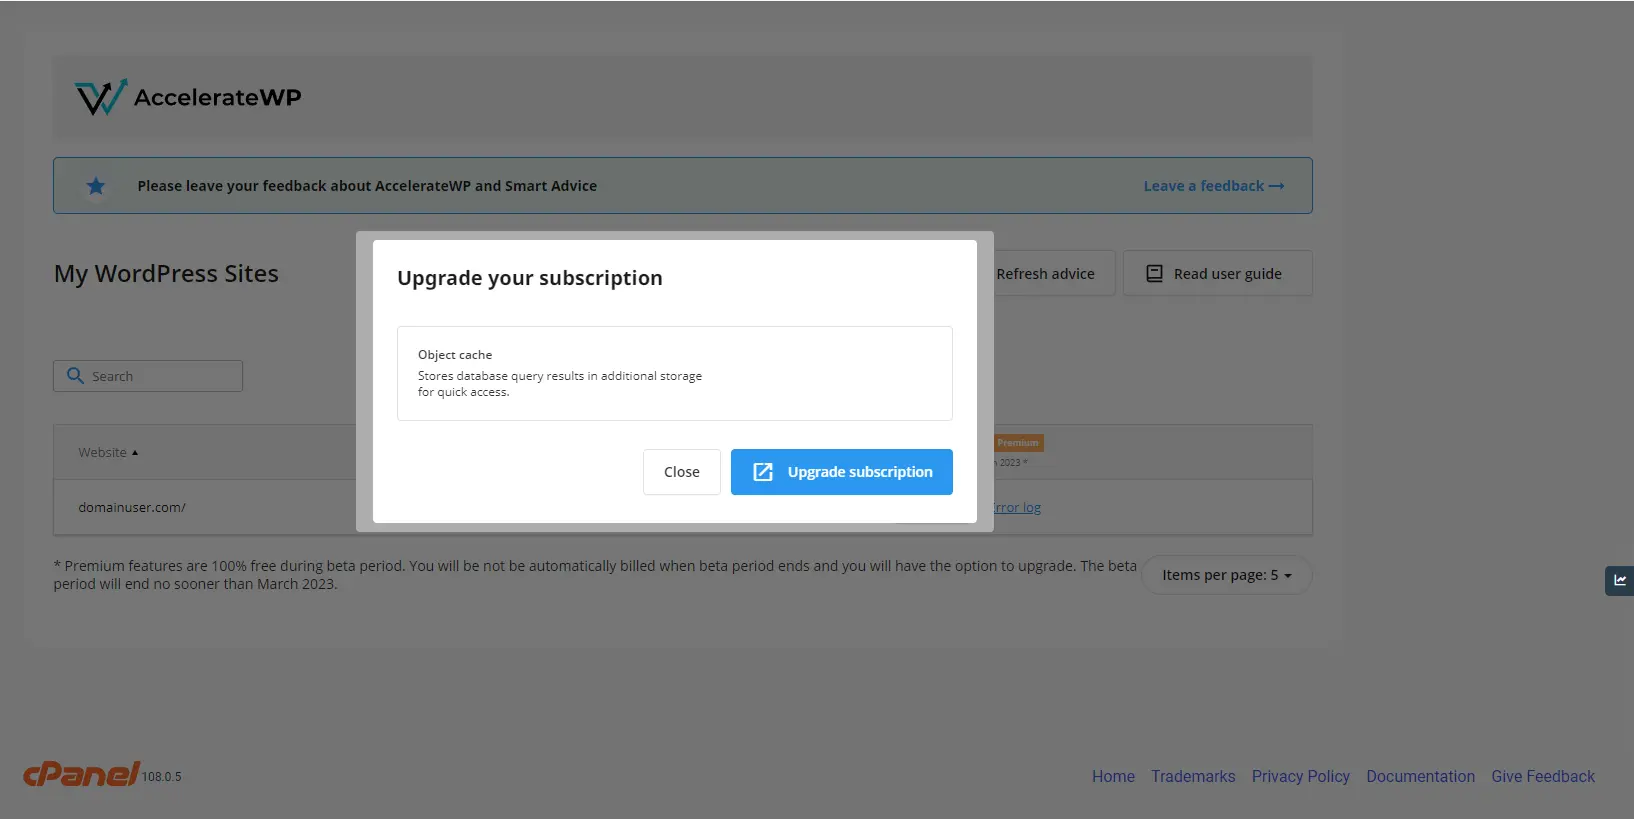
When AccelerateWP Premium is enabled in the admin interface, users get a proposal to upgrade their subscription.
When a user upgrades the subscription to the plan with AccelerateWP support, billing must execute the following command on the server:
cloudlinux-awp-admin set-suite --suites=accelerate_wp_premium --allowed --source=BILLING_OVERRIDE --users=<username>
This command makes two things:
- allow the user to install the plugin, bypassing the upgrade window;
- reports premium as being used to CLN, starting the billing cycle for the hoster.
When the user terminates or downgrades the plan, the following command must be executed by the billing system:
cloudlinux-awp-admin set-suite --suites=accelerate_wp_premium --default --source=BILLING_OVERRIDE --users=<username>
Setup upgrade URL for AccelerateWP Premium
The upgrade window can be customized with a link to the plan upgrade page, which can be set using the CLI command:
cloudlinux-awp-admin set-options --upgrade-url https://plan.upgrade/splash
AccelerateWP automatically appends GET parameters when the link is displayed.
https://plan.upgrade/splash/?m=acceleratewp&action=provisioning&username=democom&domain=demo.com&server_ip=10.51.0.10
| Parameter | Value | Description |
|---|---|---|
| m | acceleratewp | Constant. |
| action | provisioning | Constant. |
| username | democom | Customer's account name. |
| domain | demo.com | Customer's account primary domain. |
| server_ip | 10.51.0.10 | Primary IP of the server where AccelerateWP is installed |
Parameters can be used to determine the billing account of the user in order to display the proper page. WHMCS plugin already has an automatic redirect to the upgrade page, there is only needed to set upgrade-url to the root of your WHMCS instance.
cloudlinux-awp-admin set-options --upgrade-url https://whmcs.mydomain.zone/
Upgrade URL is opened in a modal browser window and will be automatically closed when AccelerateWP receives a callback about the successful upgrade.
The callback is already implemented in the WHMCS plugin, but if you are using some other billing, you should add the following code on the page which appears when a user successfully upgrades the subscription.
<script>
if(window.opener && !window.opener.closed) {
    window.opener.postMessage('PAYMENT_SUCCESS', '*');
}
</script>
In order to remove the link, just set the upgrade URL to the empty one.
cloudlinux-awp-admin set-options --upgrade-url ''
Disable AccelerateWP Premium
If you would like to stop using AccelerateWP Premium, click on the manage link and remove the Premium Features checkbox. AccelerateWP will be still available for your users.
Disable AccelerateWP
If you would like to stop using AccelerateWP completely, toggle the AccelerateWP back. Both AccelerateWP and AccelerateWP Premium will be turned off.
This operation will:
- disable the AccelerateWP tab in the users' control panel interface
- disable all AccelerateWP optimization suites
- deactivate all optimization features for all users
This operation will NOT:
- cancel the subscription made by the user in WHMCS or other billing. The user's subscription stays alive and the user will still be charged in the billing system unless the hoster manually makes a refund
Logs
The main AccelerateWP log is located at
/var/log/clwpos/main.log
In case AccelerateWP Premium is active, the auxiliary monitoring daemon clwpos_monitoring is also activated. Its log is located at
/var/log/clwpos/daemon.log
FAQ
With which panel can I use AccelerateWP?
AccelerateWP is compatible with cPanel, Plesk, and DirectAdmin, and it also supports custom control panel integration.
Is it possible to use AccelerateWP on a non-control panel server?
Yes, if a custom integration mechanism is used: custom control panel integration.
Do you plan to enable support of the Nginx server?
This is a part of our very long-term plans, thus not expected in the nearest future.
How will it help my customers?
AccelerateWP is a complex solution to help your customers increase their WordPress site performance. AccelerateWP brings number of optimization features, like object caching, css and js preprocessing and website preloading.
How could I monitor Redis instances while using the AccelerateWP Premium suite?
The Redis process is started for a user after activating the AccelerateWP Premium Object Caching feature for at least one WordPress site. It is killed after AccelerateWP Premium Object Caching has been deactivated for all user's websites.
Look through the processes list to check the Redis status for a particular user:
 ps aux | grep redis

 awpuser  2662517  0.0  0.5 101096  8512 ?        Sl   15:33   0:00 /opt/alt/redis/bin/redis-server unixsocket:/home/awpuser/.clwpos/redis.sock
In case if AccelerateWP Premium is active, the auxiliary monitoring daemon clwpos_monitoring is also activated. It checks Redis instances each 5 minutes, starts new instances, restart failed ones and kills the “garbage” instances if needed. Check daemon status using service clwpos_monitoring status and its main log: /var/log/clwpos/daemon.log.
My users are complaining that their features are not installed automatically after a subscription upgrade
This can be caused by several reasons. Either your customer's website was detected to be malfunctioning or there was an issue with the environment when the feature was installed (e.g. bad internet connectivity with the WordPress market).
First, try to enable the feature manually using the AccelerateWP interface. Most likely you will find a human-readable error message there.
Next, you can try to dive into /var/log/clwpos/daemon.log and find the reason why the enable command failed. Here is an example of a successful feature installation for reference:
2023-02-14 11:01:14,696: (clwpos.daemon_base) [INFO] Running cloudlinux-awp-user enable --feature object_cache --domain wpujj.com --wp-path
2023-02-14 11:01:15,081: (clwpos.daemon_base) [INFO] Command succeded with output:
`CompletedProcess(args=['/bin/cagefs_enter.proxied', 'cloudlinux-awp-user', 'enable', '--feature', 'object_cache', '--domain', 'wpujj.com', '--wp-path', ''], returncode=0,
stdout='{\n "context": {\n "domain": "wpujj.com",\n "feature": "object_cache"\n  },\n  "result": "success",\n "timestamp": 1676372475.044419,\n \n}\n', stderr='')`
2023-02-14 11:01:15,086: (clwpos.daemon_base) [INFO] background process finished: pid=415368
Also, some useful notes may be present in the user's log located at /home/<username>/.clwpos/main.log.
If the issue persists, or you cannot resolve it yourself, contact CloudLinux support and attach /var/log/clwpos/daemon.log and /home/<username>/.clwpos/main.log for further investigation.
Troubleshooting
End-users of AccelerateWP Premium feature encounter Redis extension is not installed for selected php version
In order to make use of the AccelerateWP Premium Object Caching feature, the loaded Redis extension is required for the end-user's website. End-users will not be able to activate the Object Caching feature until the Redis extension configuration is incomplete.
Corresponding incompatibility warning will be displayed in the control panel's User interface:
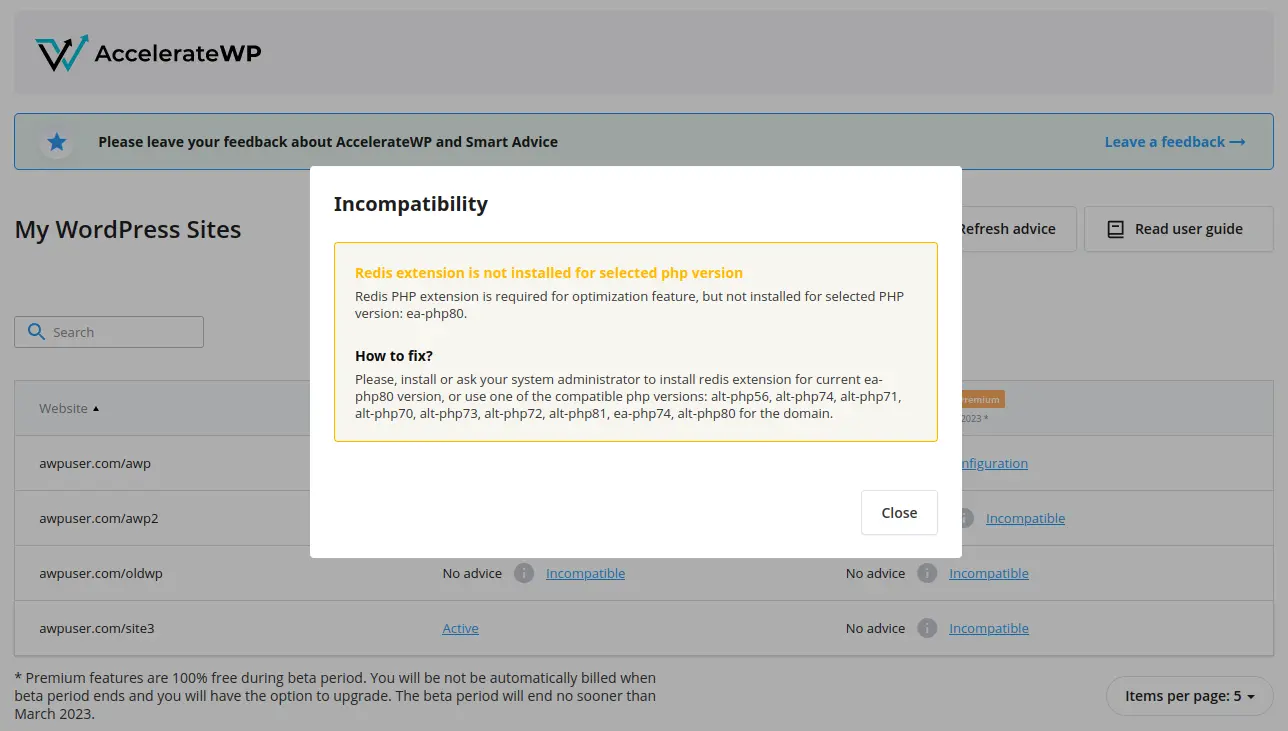
The Redis extensions are configured for all installed and supported PHP versions automatically:
- right after the AccelerateWP Premium suite is enabled
- by cron once a day
or you can trigger the utility manually:
/usr/sbin/enable_redis_for_panel_php
All errors will be displayed in standard output and logged into /var/log/clwpos/main.log.
Ensuring the EA-PHP Redis extension is configured correctly
Check Redis extension package is installed by running the following command
rpm -q ea-phpXY-php-redisInstall the corresponding extension if it is not present:
yum install ea-phpXY-php-redisConsider the example for checking out and installing the Redis extension for
ea-php74:rpm -q ea-php74-php-redis yum install ea-php74-php-redisCheck Redis
inifile is present by running the following command:ls /opt/cpanel/ea-phpXY/root/etc/php.d/ | grep 50-redisConsider the example for checking out Redis extension for
ea-php74:ls /opt/cpanel/ea-php74/root/etc/php.d/ | grep 50-redisTry reinstalling the package if
inifile is missing.Make sure the Redis module is loaded under a specific user by running the following command:
su -c "php -m | grep redis" <username>
Ensuring the ALT-PHP Redis extension is configured correctly
Check if
redis.sois present for a particular alt-php version:ls /opt/alt/phpXY/usr/lib64/php/modules | grep redis.soConsider the example for checking alt-php74 redis.so:
ls /opt/alt/php74/usr/lib64/php/modules | grep redis.so
redis.so
If the Redis module is missing:
a. Install the
alt-phpXY-pecl-extpackage manually b. Run the Redis configuration script/usr/share/cloudlinux/wpos/enable_redis_for_alt_php.pyAll errors will be displayed in standard output and logged into
/var/log/clwpos/main.log.If the Redis module is present for a particular php version, but the incompatibility issue persists, re-check the following:
a. Make sure the Redis module is loaded under user:
su -c "php -m | grep redis" <username>b. Check the required extensions are enabled in
php.ini:cat /opt/alt/phpXY/etc/php.ini | grep redis.so cat /opt/alt/phpXY/etc/php.ini | grep json.so cat /opt/alt/phpXY/etc/php.ini | grep igbinary.soc. Enable missing extensions manually.
End-users of AccelerateWP encounter PHP-related issues during feature activation
End-users may encounter PHP-related errors while activating the AccelerateWP features.
The general examples of possible reasons are:
- broken PHP binaries
- missing PHP files
- etc.
To check that this issue is caused by PHP itself, call any PHP command, for example:
/opt/cpanel/ea-php80/root/usr/bin/php -i
And make sure that installed ea-php80 packages are not broken using rpm -V <package_name>.
Reinstall broken packages if found.
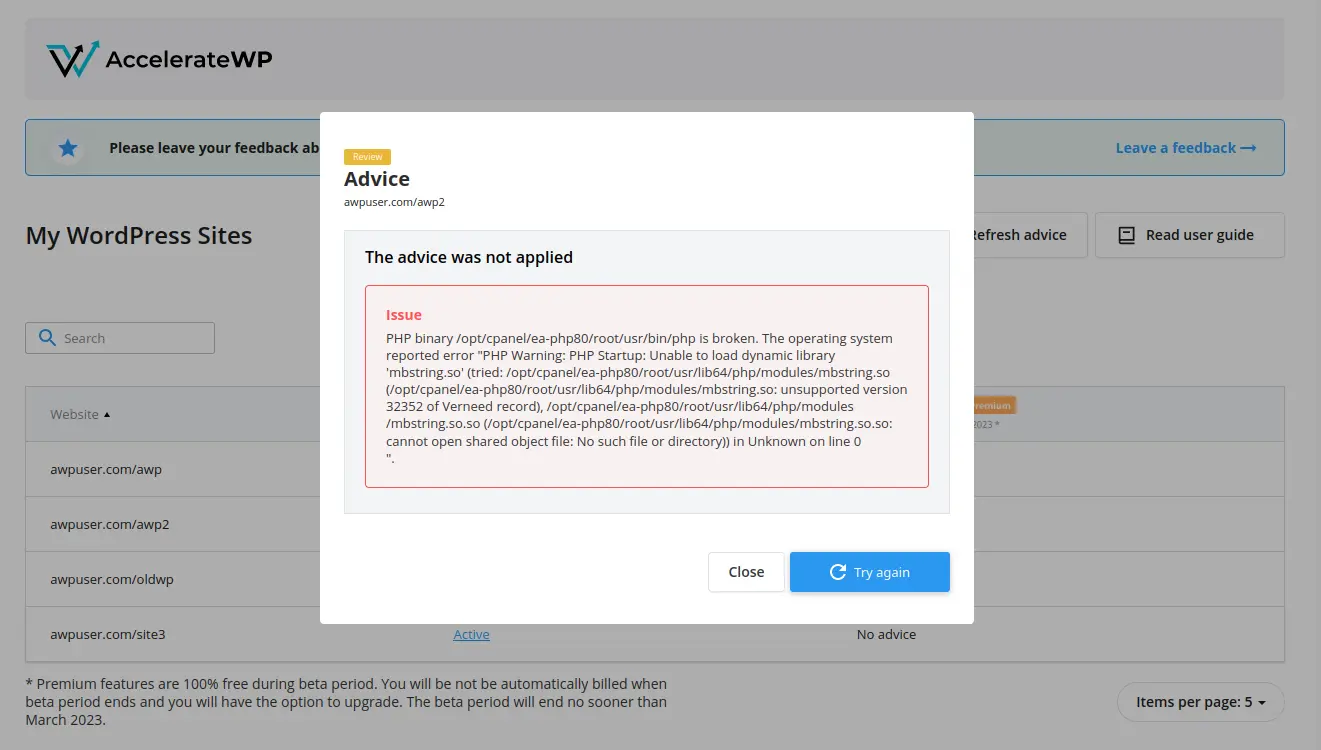
Consider the example issue (presented at the picture above) with broken mbstring.so for ea-php80:
/opt/cpanel/ea-php80/root/usr/bin/php -i
Segmentation fault (core dumped)

rpm -V ea-php80

rpm -V ea-php80-php-mbstring
S.5....T.    /opt/cpanel/ea-php80/root/usr/lib64/php/modules/mbstring.so
......G..  a /usr/lib/.build-id/9c/38ed78a6d401ff6dce059ccea51c95870d98c5

yum reinstall ea-php80-php-mbstring
MAx Cache documentation
Overview
mod_maxcache is an Apache 2.4 module that directly serves static cache files without requiring any mod_rewrite rules in .htaccess. The module handles the entire cache lookup internally - computing the cache path, checking for file existence, and serving the static HTML directly.
This design eliminates per-request regex compilation in .htaccess, resulting in significantly faster cache delivery. The module is fully compatible with AccelerateWP's cache directory layout and can be used by any caching plugin that follows similar conventions.
AccelerateWP uses this module to serve the correct static page without invoking PHP or writing complex RewriteRule-based configurations. This document summarizes the module's directives and describes how any page cache plugin can integrate with the same capabilities.
The module includes two independent subsystems: cache serving (serves pre-generated static HTML files, bypassing PHP) and full .htaccess caching (caches parsed .htaccess files in shared memory, eliminating per-request disk I/O). Both are included in the same ea-apache24-mod_maxcache package and can be enabled independently.
Note:
MAx Cache is currently supported on cPanel control panels only.
MAx Cache Installation
To install MAx Cache, run the following commands:
yum install accelerate-wp cloudlinux-site-optimization-module libmaxcache --enablerepo=cloudlinux-updates-testing
yum install ea-apache24-mod_maxcache --enablerepo=cl-ea4-testing
| Package | Description |
|---|---|
ea-apache24-mod_maxcache | Apache module with cache serving and full .htaccess caching subsystems |
libmaxcache | Shared C library for device detection, WebP, cookie/QS handling |
After installation, the full .htaccess caching subsystem is enabled by default (MaxCacheHtaccess On). Change detection uses per-request stat() polling — no separate daemon is required.
MAx Cache Activation Guide
Use the following commands to manage MAx Cache on your server via the cloudlinux-awp-admin tool.
Note on Prerequisites
Important: For either command to work, the AccelerateWP plugin must be installed and up-to-date on the WordPress sites you are targeting. Old versions of the plugin do not support the current configuration.
1. Bulk Activation (Server-Wide)
Use this command to enable MAx Cache for all compatible websites on the server at once.
cloudlinux-awp-admin maxcache enable --all
What this does:
- Mass Deployment: Activates the MAx Cache feature directly on every compatible WordPress site hosted on the server.
- Prerequisite: Ensure the AccelerateWP plugin is updated on the target sites before running this. The configuration requires the latest plugin version to apply successfully.
2. Single Site Activation
Use this command to enable MAx Cache for a specific WordPress installation.
cloudlinux-awp-admin maxcache --enable --user {USERNAME} --domain {USERDOMAIN}
Parameters:
--user {USERNAME}: Replace{USERNAME}with the system username of the account (e.g.,john).--domain {USERDOMAIN}: Replace{USERDOMAIN}with the specific domain name (e.g.,example.com).
### Module Directives
MaxCache
- Syntax:
MaxCache On|Off - Default: Off
- Context: server config, virtual host, directory, .htaccess
- Description: Master enable/disable switch for all module features. When disabled, the module performs no processing and immediately declines the request. When enabled, the module evaluates eligibility and serves cache files when found.
- Example:
<IfModule maxcache_module>
    MaxCache On
</IfModule>
MaxCachePath
- Syntax:
MaxCachePath <template> - Default: none (required for cache serving)
- Context: .htaccess only
- Description: Defines the cache file path template using placeholders. This directive is required for the module to serve cache files. The template describes the full path under the document root where cache files are stored.
- Placeholders:
| Placeholder | Description | Example Value |
|---|---|---|
{HTTP_HOST} | Request hostname | example.com |
{REQUEST_URI} | Request URI (trailing slashes trimmed) | /article |
{USER_SUFFIX} | Per-user directory suffix | -admin-abc123 or empty |
{USER_SHARED_SUFFIX} | Shared logged-in suffix | -loggedin-abc123 or empty |
{QS_SUFFIX} | Query string suffix | #color=red or empty |
{MOBILE_SUFFIX} | Mobile device suffix | -mobile or empty |
{SSL_SUFFIX} | HTTPS suffix | -https or empty |
{WEBP_SUFFIX} | WebP suffix | -webp or empty |
{DYNAMIC_COOKIE_SUFFIX} | Dynamic cookies suffix | -usd-en or empty |
{GZIP_SUFFIX} | Gzip suffix | _gzip or empty |
- Example (standard cache layout):
MaxCachePath /wp-content/cache/{HTTP_HOST}{USER_SUFFIX}{REQUEST_URI}{QS_SUFFIX}/index{MOBILE_SUFFIX}{SSL_SUFFIX}{WEBP_SUFFIX}{DYNAMIC_COOKIE_SUFFIX}.html{GZIP_SUFFIX}
This produces cache file paths like:
/wp-content/cache/example.com/article/index-https-webp.html_gzip/wp-content/cache/example.com-admin-secret/index-mobile-https.html
MaxCacheOptions
- Syntax:
MaxCacheOptions [+-]TabletAsMobile [+-]SkipCacheOnMobile [+-]ExportVars - Default:
-TabletAsMobile -SkipCacheOnMobile -ExportVars - Context: server config, virtual host, directory, .htaccess
- Options:
| Option | Description |
|---|---|
TabletAsMobile | Treat tablets as mobile devices for both the -mobile filename suffix (when {MOBILE_SUFFIX} is used) and the SkipCacheOnMobile gate. Without SkipCacheOnMobile, this option still matters: it changes whether tablets use the -mobile cache variant. |
SkipCacheOnMobile | Never serve cached content to mobile devices (and tablets, if TabletAsMobile is also enabled). |
ExportVars | Export CL_DEVICE_TYPE and CL_SUPPORTS_WEBP to subprocess_env |
- Description: Fine-tunes mobile/tablet behavior. The
ExportVarsoption provides environment variables for use inRewriteRule:%{ENV:CL_DEVICE_TYPE}and%{ENV:CL_SUPPORTS_WEBP}. We recommend to simply useMaxCachePathinstead. - Example:
# Treat tablets as mobile
MaxCacheOptions +TabletAsMobile

# Skip cache for all mobile devices
MaxCacheOptions +SkipCacheOnMobile +TabletAsMobile
MaxCacheExcludeURI
- Syntax:
MaxCacheExcludeURI "<regex>" - Default: none
- Context: server config, virtual host, directory, .htaccess
- Description: Excludes requests whose URI matches the given regex pattern (case-insensitive). Multiple directives can be specified; if any pattern matches, the request is not served from cache.
- Important: Unlike RewriteCond rules that use
!for negation, this directive uses positive matching — URIs that match are excluded. - Performance tip: Using
MaxCacheExcludeURIpatterns like/(?:wp-content|wp-includes)/is more efficient than wrapping directives in<If "%{REQUEST_URI} !~ ...">blocks. The module checks URI exclusions early and declines immediately, avoiding further processing.
- Important: Unlike RewriteCond rules that use
- Example:
# Exclude wp-content, wp-includes, feeds, embeds, and REST API (single efficient pattern)
MaxCacheExcludeURI "/(?:wp-content|wp-includes)/|/(?:.+/)?feed(?:/(?:.+/?)?)?$|/(?:.+/)?embed/|/(index.php/)?(.*)wp-json(/.*|$)"

# Exclude WooCommerce cart and checkout
MaxCacheExcludeURI "^/(cart|checkout|my-account)(/|$)"
MaxCacheExcludeUA
- Syntax:
MaxCacheExcludeUA "<regex>" - Default: none
- Context: server config, virtual host, directory, .htaccess
- Description: Excludes requests from User-Agents that match the given regex pattern (case-insensitive). Commonly used to exclude bots that should see fresh content.
- Example:
# Exclude Facebook and WhatsApp crawlers
MaxCacheExcludeUA "^(facebookexternalhit|WhatsApp).*"
MaxCacheExcludeCookie
- Syntax:
MaxCacheExcludeCookie "<regex>" - Default: none
- Context: server config, virtual host, directory, .htaccess
- Description: Excludes requests whose raw
Cookieheader matches the given regex pattern (case-insensitive). Used to bypass cache for logged-in users or users with specific session cookies. - Example:
# Exclude logged-in users, password-protected posts, etc.
MaxCacheExcludeCookie "(wordpress_logged_in_.+|wp-postpass_|wptouch_switch_toggle|comment_author_|comment_author_email_)"
MaxCacheMandatoryCookies
- Syntax:
MaxCacheMandatoryCookies <cookie1> [<cookie2> ...] - Default: none
- Context: server config, virtual host, directory, .htaccess
- Description: Declares cookie names that must be present in the request for cache serving to occur. If any mandatory cookie is missing, the request falls back to PHP. Useful for gated content or opt-in caching scenarios.
- Example:
# Only serve cache if user has accepted cookies
MaxCacheMandatoryCookies cookie_consent
MaxCacheDynamicCookies
- Syntax:
MaxCacheDynamicCookies <token> [<token> ...] - Default: none
- Context: server config, virtual host, directory, .htaccess
- Description: Declares cookie names whose values become part of the cache filename via
{DYNAMIC_COOKIE_SUFFIX}. Supports both scalar cookies (currency) and nested cookies (preferences[language]). - Normalization:
- Cookie values are sanitized to
[A-Za-z0-9_-](others become-) - Result is lowercased
- Underscores are converted to hyphens
- Each value is prefixed with
-
- Cookie values are sanitized to
- Example:
# Cache varies by currency and language
MaxCacheDynamicCookies currency language

# Request with Cookie: currency=USD; language=en_US
# Results in suffix: -usd-en-us
# Full filename: index-https-usd-en-us.html
MaxCacheQSAllowedParams
- Syntax:
MaxCacheQSAllowedParams <param1> [<param2> ...] - Default: none
- Context: server config, virtual host, directory, .htaccess
- Description: Declares query parameters that enable query-string cache variants. When at least one allowlisted parameter is present, the module:
- Removes any keys listed in
MaxCacheQSIgnoredParams - Sorts remaining keys ascending
- Builds a normalized query string
- Appends
#<normalized_query>to the cache directory path via{QS_SUFFIX} - If no allowlisted parameter is present, requests with query strings are not served from cache (fall back to PHP).
- Removes any keys listed in
- Example:
# Allow caching for search and pagination
MaxCacheQSAllowedParams s paged

# Request: /search/?s=hello&page=2
# Cache path includes: #paged=2&s=hello
MaxCacheQSIgnoredParams
- Syntax:
MaxCacheQSIgnoredParams <param1> [<param2> ...] - Default: none
- Context: server config, virtual host, directory, .htaccess
- Description: Declares query parameters that are removed from the cache key. These parameters never affect cache variants—they're stripped before the query string is normalized.
- Example:
# Ignore tracking parameters
MaxCacheQSIgnoredParams utm_source utm_medium utm_campaign fbclid gclid

# Request: /products/?color=red&utm_source=google
# Cache key uses only: #color=red
MaxCacheIgnoreHeaders
- Syntax:
MaxCacheIgnoreHeaders "Header-Name: Substring" - Default: none
- Context: server config, virtual host, directory, .htaccess
- Description: Skip cache serving for requests carrying specific headers. The header value is checked for substring match.
- Example:
# Don't serve cache for AJAX requests
MaxCacheIgnoreHeaders "X-Requested-With: XMLHttpRequest"
MaxCacheLoggedHash
- Syntax:
MaxCacheLoggedHash "<secret_key>" - Default: none
- Context: server config, virtual host, directory, .htaccess
- Description: Sets the secret key used for logged-in user cache directories.
- Example:
MaxCacheLoggedHash "your-secret-key"
Integration Guide for Plugin Developers
This guide walks you through integrating mod_maxcache with your caching plugin. We'll start with the absolute basics and progressively add features until we reach a battle-tested production configuration.
Philosophy:
Each step builds on the previous one. Copy the final configuration that matches your needs, or follow along to understand how each piece works.
Step 1: Basic Caching
The simplest possible configuration — just two lines to start serving cached pages:
<IfModule maxcache_module>
    MaxCache On
    MaxCachePath /wp-content/cache/{HTTP_HOST}{REQUEST_URI}/index.html
</IfModule>
What this does:
- Serves
/wp-content/cache/example.com/about-us/index.htmlfor requests tohttps://example.com/about-us/ - Falls through to PHP if the cache file doesn't exist
Cache path breakdown:
| Request | Cache File |
|---|---|
https://example.com/ | /wp-content/cache/example.com/index.html |
https://example.com/blog/ | /wp-content/cache/example.com/blog/index.html |
https://example.com/products/widget/ | /wp-content/cache/example.com/products/widget/index.html |
Step 2: HTTPS Awareness with {SSL_SUFFIX}
Most sites serve different content (or at least different URLs) over HTTP vs HTTPS. Add {SSL_SUFFIX} to create separate cache files:
<IfModule maxcache_module>
    MaxCache On
    MaxCachePath /wp-content/cache/{HTTP_HOST}{REQUEST_URI}/index{SSL_SUFFIX}.html
</IfModule>
What changes:
- HTTPS requests →
index-https.html - HTTP requests →
index.html
| Request | Cache File |
|---|---|
https://example.com/ | .../example.com/index-https.html |
http://example.com/ | .../example.com/index.html |
Step 3: Mobile-Optimized Caching with {MOBILE_SUFFIX}
Serve different cached pages to mobile devices—critical for sites with responsive designs that differ significantly between desktop and mobile:
<IfModule maxcache_module>
    MaxCache On
    MaxCachePath /wp-content/cache/{HTTP_HOST}{REQUEST_URI}/index{MOBILE_SUFFIX}{SSL_SUFFIX}.html
</IfModule>
What changes:
- Desktop requests →
index-https.html - Mobile requests →
index-mobile-https.html
The module uses intelligent User-Agent detection to identify mobile devices. No configuration needed — it just works.
| Device | Request | Cache File |
|---|---|---|
| Desktop | https://example.com/ | index-https.html |
| iPhone | https://example.com/ | index-mobile-https.html |
| iPad | https://example.com/ | index-https.html (tablets = desktop by default) |
Tip:
Want tablets treated as mobile? Add MaxCacheOptions +TabletAsMobile
Step 4: Gzip Compression Support
Serve pre-compressed cache files for faster delivery. Just add the gzip suffix:
<IfModule maxcache_module>
    MaxCache On
    MaxCachePath /wp-content/cache/{HTTP_HOST}{REQUEST_URI}/index{MOBILE_SUFFIX}{SSL_SUFFIX}.html{GZIP_SUFFIX}
</IfModule>
What changes:
- Cache files now end with
.html_gzipfor browser which support gzip encoding - Apache serves these with proper
Content-Encoding: gzipheaders - Browsers decompress automatically — users see faster load times
- Clients without gzip support still get non-compressed
.htmlcache files
Step 5: Protecting Dynamic Content with Exclusions
Not everything should be cached. Add exclusion rules to bypass the cache for dynamic content:
<IfModule maxcache_module>
    MaxCache On

    # Bypass cache for feeds, embeds, REST API, and WordPress internals
    MaxCacheExcludeURI "/(?:.+/)?feed(?:/(?:.+/?)?)?$|/(?:.+/)?embed/|/(?:wp-content|wp-includes)/|/(index.php/)?(.*)wp-json(/.*|$)"

    MaxCachePath /wp-content/cache/{HTTP_HOST}{REQUEST_URI}/index{MOBILE_SUFFIX}{SSL_SUFFIX}.html{GZIP_SUFFIX}
</IfModule>
What this excludes:
| Pattern | Matches |
|---|---|
/feed/ | RSS/Atom feeds at any level |
/embed/ | Embed endpoints |
/wp-content/, /wp-includes/ | Static assets (let Apache handle directly) |
/wp-json/ | REST API calls |
Why positive matching? Unlike RewriteCond's ! negation, MaxCacheExcludeURI uses positive matching — patterns that match are excluded. This is more intuitive: "exclude URIs that look like this."
Step 6: Handling Bots and Crawlers
Some bots need fresh content. Exclude them by User-Agent:
<IfModule maxcache_module>
    MaxCache On

    MaxCacheExcludeURI "/(?:.+/)?feed(?:/(?:.+/?)?)?$|/(?:.+/)?embed/|/(?:wp-content|wp-includes)/|/(index.php/)?(.*)wp-json(/.*|$)"

    # Facebook and WhatsApp crawlers should see fresh content for link previews
    MaxCacheExcludeUA "^(facebookexternalhit|WhatsApp).*"

    MaxCachePath /wp-content/cache/{HTTP_HOST}{REQUEST_URI}/index{MOBILE_SUFFIX}{SSL_SUFFIX}.html{GZIP_SUFFIX}
</IfModule>
Step 7: Logged-In Users and Session Cookies
Exclude users with active sessions—they need dynamic, personalized content:
<IfModule maxcache_module>
    MaxCache On

    MaxCacheExcludeURI "/(?:.+/)?feed(?:/(?:.+/?)?)?$|/(?:.+/)?embed/|/(?:wp-content|wp-includes)/|/(index.php/)?(.*)wp-json(/.*|$)"
    MaxCacheExcludeUA "^(facebookexternalhit|WhatsApp).*"

    # Bypass cache for logged-in users and special sessions
    MaxCacheExcludeCookie "(wordpress_logged_in_.+|wp-postpass_|wptouch_switch_toggle|comment_author_|comment_author_email_)"

    MaxCachePath /wp-content/cache/{HTTP_HOST}{REQUEST_URI}/index{MOBILE_SUFFIX}{SSL_SUFFIX}.html{GZIP_SUFFIX}
</IfModule>
Cookies that bypass cache:
| Cookie Pattern | Meaning |
|---|---|
wordpress_logged_in_* | Logged-in WordPress users |
wp-postpass_* | Password-protected post access |
wptouch_switch_toggle | Mobile theme switcher |
comment_author_* | Users who've commented (name/email remembered) |
Step 8: Query String Intelligence with {QS_SUFFIX}
By default, URLs with query strings bypass the cache. But some query strings should be cached — like search results or paginated content.
<IfModule maxcache_module>
    MaxCache On

    # Cache these query parameters (search, pagination, language)
    MaxCacheQSAllowedParams lang s permalink_name lp-variation-id

    MaxCacheExcludeURI "/(?:.+/)?feed(?:/(?:.+/?)?)?$|/(?:.+/)?embed/|/(?:wp-content|wp-includes)/|/(index.php/)?(.*)wp-json(/.*|$)"
    MaxCacheExcludeUA "^(facebookexternalhit|WhatsApp).*"
    MaxCacheExcludeCookie "(wordpress_logged_in_.+|wp-postpass_|wptouch_switch_toggle|comment_author_|comment_author_email_)"

    # Add {QS_SUFFIX} to include query string in cache path
    MaxCachePath /wp-content/cache/{HTTP_HOST}{REQUEST_URI}{QS_SUFFIX}/index{MOBILE_SUFFIX}{SSL_SUFFIX}.html{GZIP_SUFFIX}
</IfModule>
How query strings become cache paths:
| Request | Cache Directory |
|---|---|
/?s=hello | .../example.com#s=hello/ |
/?lang=en&s=test | .../example.com#lang=en&s=test/ |
/?random=xyz | ❌ Not cached (param not in allowlist) |
Key insight:
Only requests with at least one allowed parameter get cached. Unknown query strings fall through to PHP.
Step 9: Stripping Tracking Parameters
Marketing tools add tracking parameters (utm_source, fbclid, etc.) that create cache pollution. Strip them:
<IfModule maxcache_module>
    MaxCache On

    MaxCacheQSAllowedParams lang s permalink_name lp-variation-id

    # These parameters are stripped before computing the cache key
    MaxCacheQSIgnoredParams utm_source utm_medium utm_campaign fbclid gclid

    MaxCacheExcludeURI "/(?:.+/)?feed(?:/(?:.+/?)?)?$|/(?:.+/)?embed/|/(?:wp-content|wp-includes)/|/(index.php/)?(.*)wp-json(/.*|$)"
    MaxCacheExcludeUA "^(facebookexternalhit|WhatsApp).*"
    MaxCacheExcludeCookie "(wordpress_logged_in_.+|wp-postpass_|wptouch_switch_toggle|comment_author_|comment_author_email_)"

    MaxCachePath /wp-content/cache/{HTTP_HOST}{REQUEST_URI}{QS_SUFFIX}/index{MOBILE_SUFFIX}{SSL_SUFFIX}.html{GZIP_SUFFIX}
</IfModule>
The magic:
| Request | Effective Cache Key |
|---|---|
/?s=hello&utm_source=google | #s=hello (utm_source stripped) |
/?fbclid=abc123 | ❌ Falls to PHP (no allowed params remain) |
/?s=test&gclid=xyz&lang=en | #lang=en&s=test (gclid stripped, sorted) |
Step 10: Behavior Fine-Tuning with MaxCacheOptions
Control mobile handling and enable environment variable export:
<IfModule maxcache_module>
    MaxCache On

    # -SkipCacheOnMobile: Serve cache to mobile (default)
    # -TabletAsMobile: Tablets use desktop cache (default)
    MaxCacheOptions -SkipCacheOnMobile -TabletAsMobile

    MaxCacheQSAllowedParams lang s permalink_name lp-variation-id
    MaxCacheQSIgnoredParams utm_source utm_medium utm_campaign fbclid gclid

    MaxCacheExcludeURI "/(?:.+/)?feed(?:/(?:.+/?)?)?$|/(?:.+/)?embed/|/(?:wp-content|wp-includes)/|/(index.php/)?(.*)wp-json(/.*|$)"
    MaxCacheExcludeUA "^(facebookexternalhit|WhatsApp).*"
    MaxCacheExcludeCookie "(wordpress_logged_in_.+|wp-postpass_|wptouch_switch_toggle|comment_author_|comment_author_email_)"

    MaxCachePath /wp-content/cache/{HTTP_HOST}{REQUEST_URI}{QS_SUFFIX}/index{MOBILE_SUFFIX}{SSL_SUFFIX}.html{GZIP_SUFFIX}
</IfModule>
Options explained:
| Option | Effect |
|---|---|
-SkipCacheOnMobile | Mobile devices ARE served from cache (default) |
+SkipCacheOnMobile | Mobile devices always hit PHP |
-TabletAsMobile | Tablets use desktop cache variant (default) |
+TabletAsMobile | Tablets use mobile cache variant |
+ExportVars | Provides %{ENV:CL_DEVICE_TYPE} and %{ENV:CL_SUPPORTS_WEBP} for use in .htaccess. Use only if you rely on RewriteRule to build up cache file paths (not recommended) |
Production-Ready Configuration
Here's the complete, battle-tested configuration with comprehensive tracking parameter coverage:
<IfModule maxcache_module>
    MaxCache On
    MaxCacheOptions -SkipCacheOnMobile -TabletAsMobile

    MaxCacheQSAllowedParams lang s permalink_name lp-variation-id

    MaxCacheQSIgnoredParams utm_source utm_medium utm_campaign utm_expid utm_term utm_content utm_id utm_source_platform utm_creative_format utm_marketing_tactic mtm_source mtm_medium mtm_campaign mtm_keyword mtm_cid mtm_content pk_source pk_medium pk_campaign pk_keyword pk_cid pk_content fb_action_ids fb_action_types fb_source fbclid campaignid adgroupid adid gclid age-verified ao_noptimize usqp cn-reloaded _ga sscid gclsrc _gl mc_cid mc_eid _bta_tid _bta_c trk_contact trk_msg trk_module trk_sid gdfms gdftrk gdffi _ke _kx redirect_log_mongo_id redirect_mongo_id sb_referer_host mkwid pcrid ef_id s_kwcid msclkid dm_i epik pp gbraid wbraid ssp_iabi ssp_iaba gad vgo_ee gad_source gad_campaignid onlywprocket srsltid gadid fbadid

    MaxCacheExcludeURI "/(?:.+/)?feed(?:/(?:.+/?)?)?$|/(?:.+/)?embed/|/(?:wp-content|wp-includes)/|/(index.php/)?(.*)wp-json(/.*|$)"
    MaxCacheExcludeUA "^(facebookexternalhit|WhatsApp).*"
    MaxCacheExcludeCookie "(wordpress_logged_in_.+|wp-postpass_|wptouch_switch_toggle|comment_author_|comment_author_email_)"

    MaxCachePath /wp-content/cache/{HTTP_HOST}{REQUEST_URI}{QS_SUFFIX}/index{MOBILE_SUFFIX}{SSL_SUFFIX}.html{GZIP_SUFFIX}
</IfModule>
What's in that massive MaxCacheQSIgnoredParams list?
| Category | Parameters |
|---|---|
| Google Analytics | utm_*, gclid, gclsrc, _ga, _gl, gad* |
fb_*, fbclid, fbadid | |
| Microsoft | msclkid, s_kwcid |
| Matomo | mtm_*, pk_* |
| Email Marketing | mc_cid, mc_eid, _bta_*, trk_*, _ke, _kx |
| Affiliate/Misc | epik, gbraid, wbraid, srsltid, and more |
Bonus: Advanced Configurations
Per-User Cache for Logged-In Users
Enable caching for logged-in users with per-user cache directories:
<IfModule maxcache_module>
    MaxCache On

    # Must match your plugin's secret_cache_key option
    MaxCacheLoggedHash "your-secret-key-here"

    # Remove wordpress_logged_in_ from exclusions to enable per-user cache
    MaxCacheExcludeCookie "(wp-postpass_|wptouch_switch_toggle|comment_author_|comment_author_email_)"

    # {USER_SUFFIX} creates per-user directories like: example.com-alice-abc123/
    MaxCachePath /wp-content/cache/{HTTP_HOST}{USER_SUFFIX}{REQUEST_URI}/index{MOBILE_SUFFIX}{SSL_SUFFIX}.html{GZIP_SUFFIX}
</IfModule>
Dynamic Cookie Variations (Currency/Language)
Cache different versions based on cookie values:
<IfModule maxcache_module>
    MaxCache On

    # Cache varies by these cookie values
    MaxCacheDynamicCookies currency language

    # {DYNAMIC_COOKIE_SUFFIX} adds -usd-en style suffixes
    MaxCachePath /wp-content/cache/{HTTP_HOST}{REQUEST_URI}/index{MOBILE_SUFFIX}{SSL_SUFFIX}{DYNAMIC_COOKIE_SUFFIX}.html{GZIP_SUFFIX}
</IfModule>
Result: Cookie: currency=USD; language=en → index-https-usd-en.html_gzip
Cache Path Construction
For a complete understanding, here's how the module builds cache paths:
Eligibility checks (in order):
- Is
MaxCacheOn? - Is request method
GET? - For query strings: is at least one
MaxCacheQSAllowedParamskey present? (if not, request is declined) - Do any
MaxCacheIgnoreHeadersmatch? - Do any
MaxCacheExcludeURIpatterns match? - Do any
MaxCacheExcludeUApatterns match? - Do any
MaxCacheExcludeCookiepatterns match? - Are all
MaxCacheMandatoryCookiespresent? - Is
MaxCacheOptions +SkipCacheOnMobileenabled and device is mobile/tablet?
- Is
Template evaluation (lazy, only if eligible):
- Parse
MaxCachePathinto segments - Evaluate each placeholder as needed
- Build complete cache URI
- Parse
File lookup:
- Construct filesystem path:
<DocumentRoot><cache_uri> - Check if file exists and is a regular file
- If found: rewrite request to serve static file
- If not found: decline (request falls through to PHP)
- Construct filesystem path:
Performance Notes
The module is designed for maximum performance:
- No RewriteRule parsing: The module handles cache logic internally, avoiding per-request regex compilation in
.htaccess - Lazy evaluation: Template placeholders are only evaluated for eligible requests
- Regex caching: Exclusion patterns are compiled once and cached across requests
- Early exit: Non-cacheable requests (wrong method, excluded, etc.) exit quickly without file I/O
Benchmarks show significant improvements over RewriteRule-based caching, especially for high-traffic sites with complex .htaccess configurations.
AccelerateWP plugin limitation
MAx Cache will not work in AccelerateWP when:
- The site is a WordPress Multisite (the MAx Cache .htaccess block is skipped).
- The site language is Korean (ko_KR) (the MAx Cache .htaccess block is skipped).
- Using the AccelerateWP PHP filter to replace dots with underscores.
- Using the AccelerateWP PHP filter forces the full path to cache files instead of using DOCUMENT_ROOT.
Full .htaccess caching
Full .htaccess caching is the second subsystem of mod_maxcache. It caches parsed .htaccess files in shared memory, so Apache does not re-read and re-parse them from disk on every request. On shared-hosting servers with thousands of sites, this eliminates thousands of stat() and open() syscalls per second.
Full .htaccess caching benefits all .htaccess-heavy sites regardless of whether MAx Cache page caching is enabled.
How it works
By default, Apache re-reads and re-parses .htaccess files from disk on every request. On shared-hosting servers with thousands of sites, this creates significant disk I/O overhead. Full .htaccess caching parses each .htaccess once (on first request) and stores the result in shared memory so all Apache workers can reuse it without touching the disk again. The cache populates lazily as traffic arrives.
Change detection
Full .htaccess caching detects .htaccess changes through per-request stat() polling. Each cached entry on the current request path is checked against disk when its per-entry timer expires (controlled by MaxCacheHtaccessRevalidateInterval).
MaxCacheHtaccessRevalidateInterval | Detection latency | Trade-off |
|---|---|---|
0 (default) | Immediate (next request) | Every request stat()s each cached directory on its path |
N seconds | Up to N seconds | Fewer stat() syscalls on busy paths, slower change pick-up |
With the default value of 0, any .htaccess create, modify, or delete is detected on the very next request through that directory — no separate daemon is required.
Configuration directives
All full .htaccess caching directives go inside <IfModule mod_maxcache.c> in the Apache configuration. Full .htaccess caching is configured in /etc/apache2/conf.d/maxcache_htaccess.conf.
MaxCacheHtaccess
- Syntax:
MaxCacheHtaccess On|Off - Default: On (in shipped config)
- Context: server config, virtual host
- Description: Master enable/disable switch for the full .htaccess caching subsystem.
MaxCacheHtaccessRevalidateInterval
- Syntax:
MaxCacheHtaccessRevalidateInterval <seconds> - Default: 0
- Range: 0–3600
- Context: server config, virtual host
- Description: Minimum seconds between
mtimerevalidation checks per cached entry on the request path. With the default of0, each entry isstat()'d on every request through that path for immediate change detection. Larger values reducestat()syscall traffic on busy paths at the cost of slower pick-up of.htaccessedits.
MaxCacheHtaccessEntries
- Syntax:
MaxCacheHtaccessEntries <count> - Default: 50000
- Range: 10–500000
- Context: server config, virtual host
- Description: Maximum number of cached
.htaccessentries in shared memory. When this limit is reached, new directories fall back to Apache's standard processing.
MaxCacheHtaccessMemorySize
- Syntax:
MaxCacheHtaccessMemorySize <MB> - Default: auto (derived from
MaxCacheHtaccessEntries) - Range: 1–4096
- Context: server config, virtual host
- Description: Shared memory arena size in megabytes. Normally sized automatically — only set this if you see
maxcache-htaccess: arena memory exhaustedin the error log.
MaxCacheHtaccessExclude
- Syntax:
MaxCacheHtaccessExclude <path> [path2] ... - Default: none
- Context: server config, virtual host
- Description: Exclude directory trees from full .htaccess caching. The path is matched as a prefix.
- Example:
MaxCacheHtaccessExclude /home/staging /tmp
MaxCacheHtaccessMaxFileSize
- Syntax:
MaxCacheHtaccessMaxFileSize <KB> - Default: 256
- Range: 0–10240
- Context: server config, virtual host
- Description: Maximum
.htaccessfile size (in KB) that full .htaccess caching will process. Files exceeding this limit are skipped and served via Apache's standard processing. Set to0for unlimited.
MaxCacheHtaccessMaxEntriesPerDocroot
- Syntax:
MaxCacheHtaccessMaxEntriesPerDocroot <count> - Default: 256
- Range: 0–100000
- Context: server config, virtual host
- Description: Maximum cached entries under a single document root. Prevents one user from monopolizing the shared cache on multi-tenant servers. Set to
0for unlimited (the globalMaxCacheHtaccessEntrieslimit still applies).
Configuration examples
Minimal setup
MaxCacheHtaccess On
Enables full .htaccess caching globally with default settings (50,000 max entries, 60-second revalidation).
Production shared hosting
For a server with ~5,000 WordPress sites:
<IfModule mod_maxcache.c>
    MaxCacheHtaccess On
    MaxCacheHtaccessEntries 100000
</IfModule>
Per-vhost with exclusions
<VirtualHost *:443>
    ServerName example.com
    DocumentRoot /home/example/public_html

    MaxCacheHtaccess On
    MaxCacheHtaccessEntries 10000
    MaxCacheHtaccessExclude /home/example/public_html/tmp
</VirtualHost>
Disable full .htaccess caching for a specific vhost
Enable globally but opt out specific vhosts:
# httpd.conf (global)
MaxCacheHtaccess On

<VirtualHost *:443>
    ServerName staging.example.com
    DocumentRoot /home/staging/public_html
    MaxCacheHtaccess Off
</VirtualHost>
Status endpoint
Full .htaccess caching provides a status handler for monitoring. To enable it, add a <Location> block to your Apache configuration:
<Location /maxcache-htaccess-status>
    SetHandler maxcache-htaccess-status
    Require local
</Location>
Then query it:
curl -s http://localhost/maxcache-htaccess-status
Example output:
MaxCache Htaccess Caching Status
================================

Mode: lazy on-demand
Enabled: yes
Ready: yes
Entries: 1234 / 50000
Lazy compiles: 5678
PCRE mode: shared (GOT patched)

Arena Architecture: Base + Patch Pool + Shadow
Active Base: Arena A
Arena size: 50MB each (x 2)
Arena usage: 8192KB / 50MB (16%)
Patch Pool: 256KB / 12MB used (2%)
Compacting: no
Compaction threshold: 80%

Revalidate interval: 0s

Cache (global):
  Hits:     45000
  Misses:   1234
Key fields to check:
| Field | Healthy value | Problem indicator |
|---|---|---|
| Enabled | yes | no — full .htaccess caching is turned off in config |
| Ready | yes | no — engine failed to initialize |
| Entries | below max | at max — increase MaxCacheHtaccessEntries |
| Arena usage | below 90% | above 90% — increase MaxCacheHtaccessMemorySize |
| Hits | increasing | staying at 0 — full .htaccess caching is not serving cached results |
The status endpoint should be restricted to localhost or trusted IPs. Remove or restrict the <Location> block in production.
Troubleshooting
| Check | Command | Expected |
|---|---|---|
| Module loaded? | httpd -M 2>&1 | grep maxcache | maxcache_module listed |
| Config valid? | httpd -t | Syntax OK |
| File too large? | wc -c /path/to/.htaccess | Under 256 KB (default MaxCacheHtaccessMaxFileSize) |
| Path excluded? | grep MaxCacheHtaccessExclude /etc/apache2/conf.d/maxcache_htaccess.conf | Path not listed |
Log: maxcache-htaccess: entry limit reached (50000/50000), skipping /path | Cache is full — increase MaxCacheHtaccessEntries | Remaining directories use standard Apache processing |
Log: maxcache-htaccess: per-docroot entry limit reached (256/256) for /home/user | Single user filled their quota — increase MaxCacheHtaccessMaxEntriesPerDocroot | Other users are not affected |
Log: maxcache-htaccess: arena memory exhausted (400MB/400MB) | Shared memory arena is full — increase MaxCacheHtaccessMemorySize | Restart Apache after changing |
If changes must take effect immediately, restart Apache: systemctl restart httpd.
MAx Cache for NGINX
Overview
MAx Cache for NGINX (ea-nginx-maxcache) is the NGINX counterpart of the Apache MAx Cache module . It serves pre-generated static HTML cache files produced by AccelerateWP directly from disk, bypassing PHP on cache hits. The module shares the same libmaxcache core library as the Apache module for device detection, WebP support, cookie handling, and query-string normalization.
MAx Cache for NGINX is currently supported on cPanel control panels only.
Installation
yum install accelerate-wp cloudlinux-site-optimization-module libmaxcache libmaxcache-configd --enablerepo=cloudlinux-updates-testing
yum install ea-nginx-maxcache --enablerepo=cl-ea4-testing
This pulls in all required dependencies:
| Package | Description |
|---|---|
ea-nginx-maxcache | NGINX dynamic module (.so file) and module loader config |
libmaxcache | Shared C library for device detection, WebP, cookie/QS handling |
libmaxcache-configd | Configuration daemon: parses .htaccess, writes shared memory |
Verify the module is loaded:
nginx -T 2>&1 | grep maxcache
# Expected: load_module "/usr/lib64/nginx/modules/ngx_http_maxcache_module.so";
The maxcache-configd daemon is enabled automatically on package install:
systemctl status maxcache-configd
journalctl -u maxcache-configd -f
Supported modes
Default: automatic via maxcache-configd daemon
In the default mode, the maxcache-configd daemon reads AccelerateWP .htaccess directives and writes parsed per-domain configuration to shared memory (/dev/shm/maxcache_config). The NGINX module reads this shared memory on each request. No manual NGINX configuration is needed per domain.
The maxcache_dynamic directive (enabled by default) and maxcache_shm_path are the only http-level directives required. The ea-nginx-maxcache package configures them automatically.
ea-nginx reverse proxy (proxy_pass)
NGINX sits in front of Apache. On a cache hit, the module serves the file directly and Apache is never contacted. On a miss, the request is proxied to Apache as usual.
ea-nginx standalone (fastcgi_pass)
NGINX handles all traffic without Apache. PHP requests go to PHP-FPM via fastcgi_pass. On a cache hit, the module serves the file directly and PHP-FPM is never contacted.
Manual NGINX configuration
For domains not managed by AccelerateWP, static directives (maxcache on, maxcache_path, exclusions, etc.) can be set directly in nginx.conf or included config files. These also serve as fallbacks when the daemon does not have configuration for a domain.
Activation
Use the cloudlinux-awp-admin tool to enable MAx Cache:
# Enable for all compatible sites on the server
cloudlinux-awp-admin maxcache enable --all

# Enable for a specific site
cloudlinux-awp-admin maxcache --enable --user {USERNAME} --domain {USERDOMAIN}
The AccelerateWP plugin must be installed and up-to-date on the target WordPress sites.
Known issues
mod_ruid2 and NGINX standalone mode
When using NGINX in standalone mode (without Apache), mod_ruid2 can cause permission issues.
mod_ruid2 changes file ownership to match the site owner's UID/GID. Cache files may end up with restrictive permissions (e.g., 0700) that the NGINX nobody user cannot read, resulting in cache misses.
Symptoms:
- NGINX always passes requests to the backend despite MaxCache being enabled.
- NGINX error log shows
permission deniedwhen opening cache files.
Resolution:
- Grant group read access to cache directories:
chmod -R g+rX /home/username/public_html/wp-content/cache/
- Or use ACLs:
setfacl -R -m u:nobody:rX /home/username/public_html/wp-content/cache/
setfacl -R -d -m u:nobody:rX /home/username/public_html/wp-content/cache/
- Or switch to ea-nginx reverse proxy (proxy_pass) mode (recommended when
mod_ruid2is active).
Configuration directives
All directives below map directly to their Apache MAx Cache counterparts . In most deployments with maxcache_dynamic on (the default), these are managed automatically by the daemon.
maxcache
Enables or disables the module.
Syntax: maxcache on | off; Default: off Context: http, server, location
maxcache_path
Cache file path template with variable substitution.
Syntax: maxcache_path "<template>"; Default: none (required when maxcache on) Context: http, server, location
Supported template variables:
| Variable | Description | Example value |
|---|---|---|
{HTTP_HOST} | Request hostname | example.com |
{REQUEST_URI} | Request URI path | /blog/hello-world |
{SSL_SUFFIX} | -https if HTTPS, empty otherwise | -https |
{MOBILE_SUFFIX} | -mobile for mobile/tablet devices | -mobile |
{WEBP_SUFFIX} | -webp if browser supports WebP | -webp |
{GZIP_SUFFIX} | _gzip if client accepts gzip | _gzip |
{QS_SUFFIX} | Normalized query string suffix | #lang=en |
{USER_SUFFIX} | Per-user cache suffix for logged-in users | -admin-a1b2c3 |
{USER_SHARED_SUFFIX} | Shared logged-in cache suffix | -loggedin-a1b2c3 |
{DYNAMIC_COOKIE_SUFFIX} | Dynamic cookie variant suffix | -fr-eur |
maxcache_options
Behavior options for mobile handling.
Syntax: maxcache_options [+|-]skip_mobile [+|-]tablet_as_mobile [+|-]export_vars; Default: all disabled Context: http, server, location
| Option | Description |
|---|---|
skip_mobile | Mobile devices bypass cache and receive dynamic content. |
tablet_as_mobile | Tablets are treated as mobile devices. |
export_vars | Exports $cl_device_type and $cl_supports_webp NGINX variables. |
maxcache_exclude_uri
Regex (case-insensitive) to exclude matching URIs from caching.
Syntax: maxcache_exclude_uri "<regex>"; Default: none Context: http, server, location
maxcache_exclude_ua
Regex (case-insensitive) to exclude matching User-Agents from caching.
Syntax: maxcache_exclude_ua "<regex>"; Default: none Context: http, server, location
maxcache_exclude_cookie
Regex (case-insensitive) to exclude requests with matching cookies from caching.
Syntax: maxcache_exclude_cookie "<regex>"; Default: none Context: http, server, location
maxcache_mandatory_cookies
Cookies that must be present for the module to serve cached content.
Syntax: maxcache_mandatory_cookies <cookie1> [cookie2] ...; Default: none Context: http, server, location
maxcache_dynamic_cookies
Cookies that create dynamic cache variants (e.g., for multi-currency or multi-language).
Syntax: maxcache_dynamic_cookies <cookie1> [cookie2] ...; Default: none Context: http, server, location
maxcache_qs_allowed_params
Query string parameters allowed in the cache key. Without this, any query string bypasses the cache.
Syntax: maxcache_qs_allowed_params <param1> [param2] ...; Default: none Context: http, server, location
maxcache_qs_ignored_params
Query string parameters to strip from the cache key (typically tracking params).
Syntax: maxcache_qs_ignored_params <param1> [param2] ...; Default: none Context: http, server, location
maxcache_ignore_headers
Request header/value pairs that bypass the cache. Format: "Header-Name: value".
Syntax: maxcache_ignore_headers "<Header>: <value>"; Default: none Context: http, server, location
maxcache_logged_hash
Secret hash for logged-in user cache keys. Must match AccelerateWP's secret_cache_key setting.
Syntax: maxcache_logged_hash "<secret_key>"; Default: none Context: http, server, location
maxcache_dynamic
Enables dynamic per-domain configuration from the maxcache-configd daemon via shared memory.
Syntax: maxcache_dynamic on | off; Default: on Context: http
maxcache_shm_path
Path to the shared memory file for daemon-to-module configuration exchange.
Syntax: maxcache_shm_path <path>; Default: /dev/shm/maxcache_config Context: http
Must match the shm_path setting in /etc/maxcache/configd.conf.
Troubleshooting
Module not loaded:
nginx -T 2>&1 | grep maxcache
Cache files missing or wrong permissions:
ls -la /home/user/public_html/wp-content/cache/example.com/
sudo -u nobody test -r /home/user/public_html/wp-content/cache/example.com/index-https.html && echo "OK" || echo "Permission denied"
Daemon not running:
systemctl status maxcache-configd
journalctl -u maxcache-configd --since "1 hour ago"
ls -la /dev/shm/maxcache_config
Force rescan after migrations:
systemctl reload maxcache-configd
Check domain is registered in daemon:
echo '{"action":"status"}' | socat - UNIX-CONNECT:/opt/cloudlinux/maxcache/notify.sock
Debug logging:
error_log /var/log/nginx/error.log debug;
Look for entries prefixed with maxcache:.
Centralized Monitoring
Description
Centralized Monitoring is a tool that allows hosting administrators to monitor load for all their servers and users.
Centralized Monitoring allows you to:
- View system metrics for all clients’ end servers
- View the LVE statistics per user for all clients’ end servers
- Enable AccelerateWP Free on all compatible servers
Installation
Note
Make sure that cm.cloudlinux.com is available on your end server.
- Make sure you have a CloudLinux OS Shared Pro subscription.
- Make sure you have installed the latest lve-utils package. You can install or update it with the following commands:
- installation
yum install lve-utils- update
yum update lve-utils - Log in to the https://cm.cloudlinux.com/ using CLN credentials (if you are already logged in via CLN, authorization via CM is not necessary, it uses SSO).
- Activate statistics collection on all your servers via the Centralized Monitoring UI or via the CLN UI. Optionally, activate the AccelerateWP Free* for all of your compatible servers.
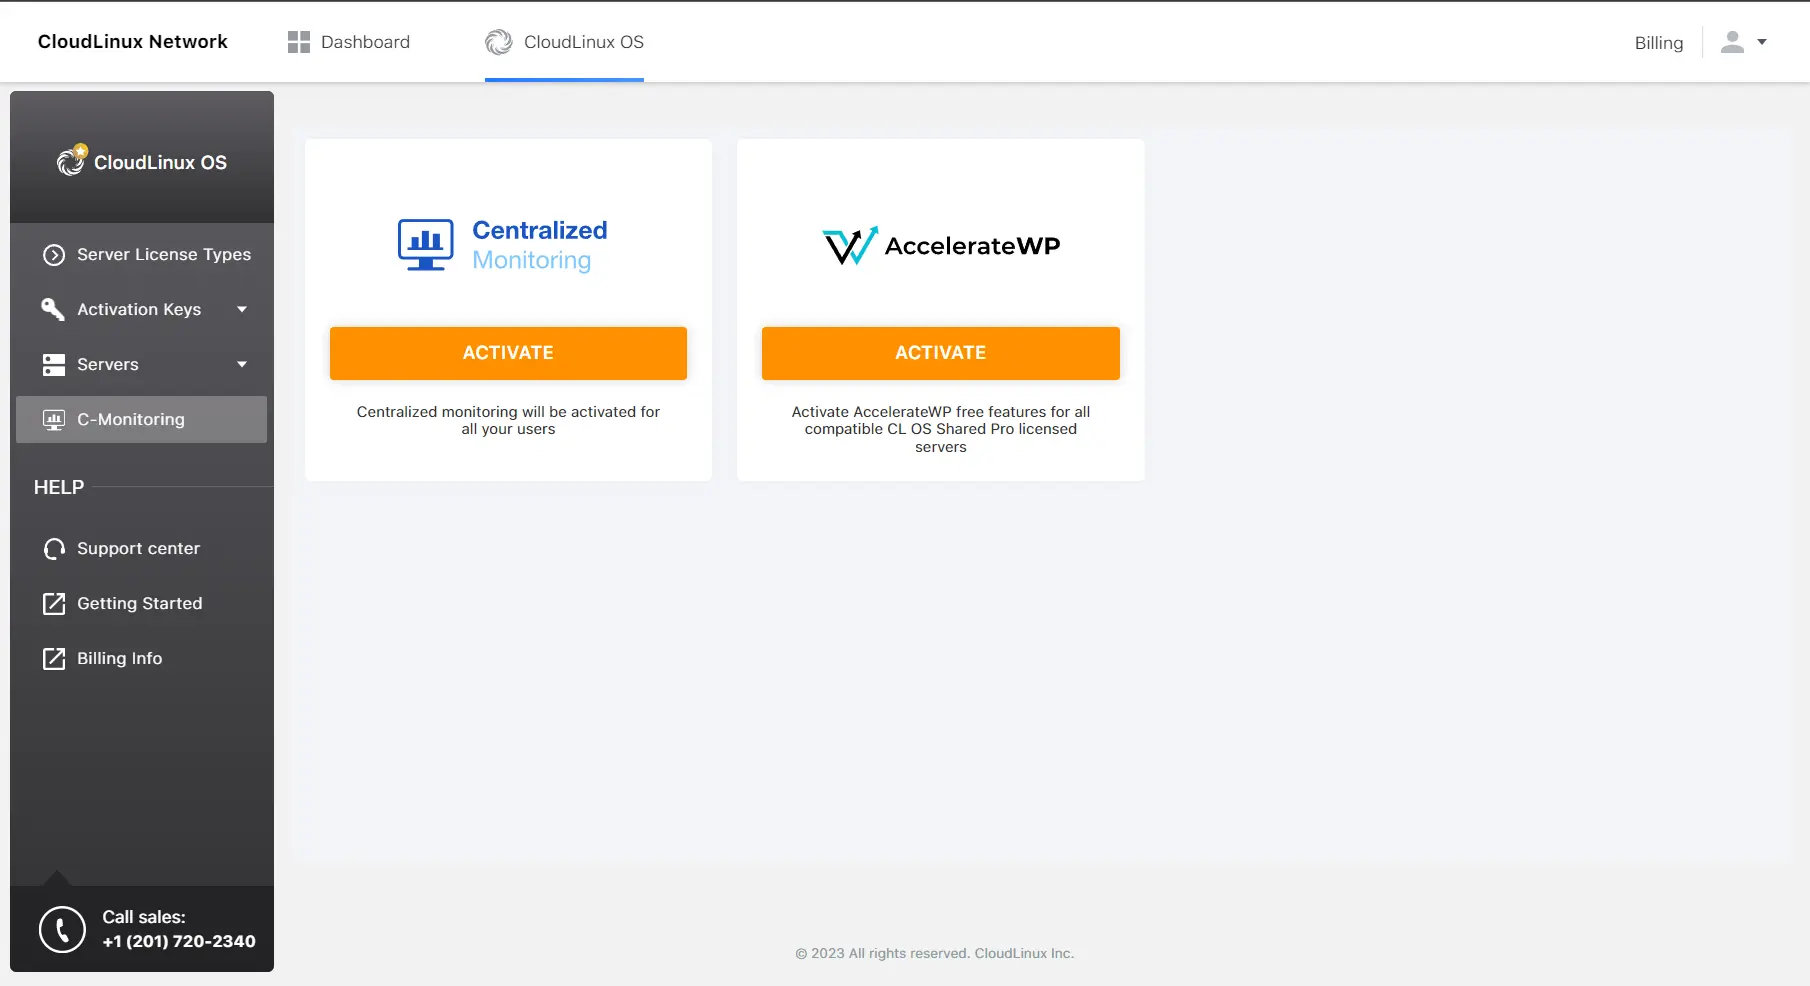 Additionally, it is possible to activate the AccelerateWP Premium* for all compatible servers.
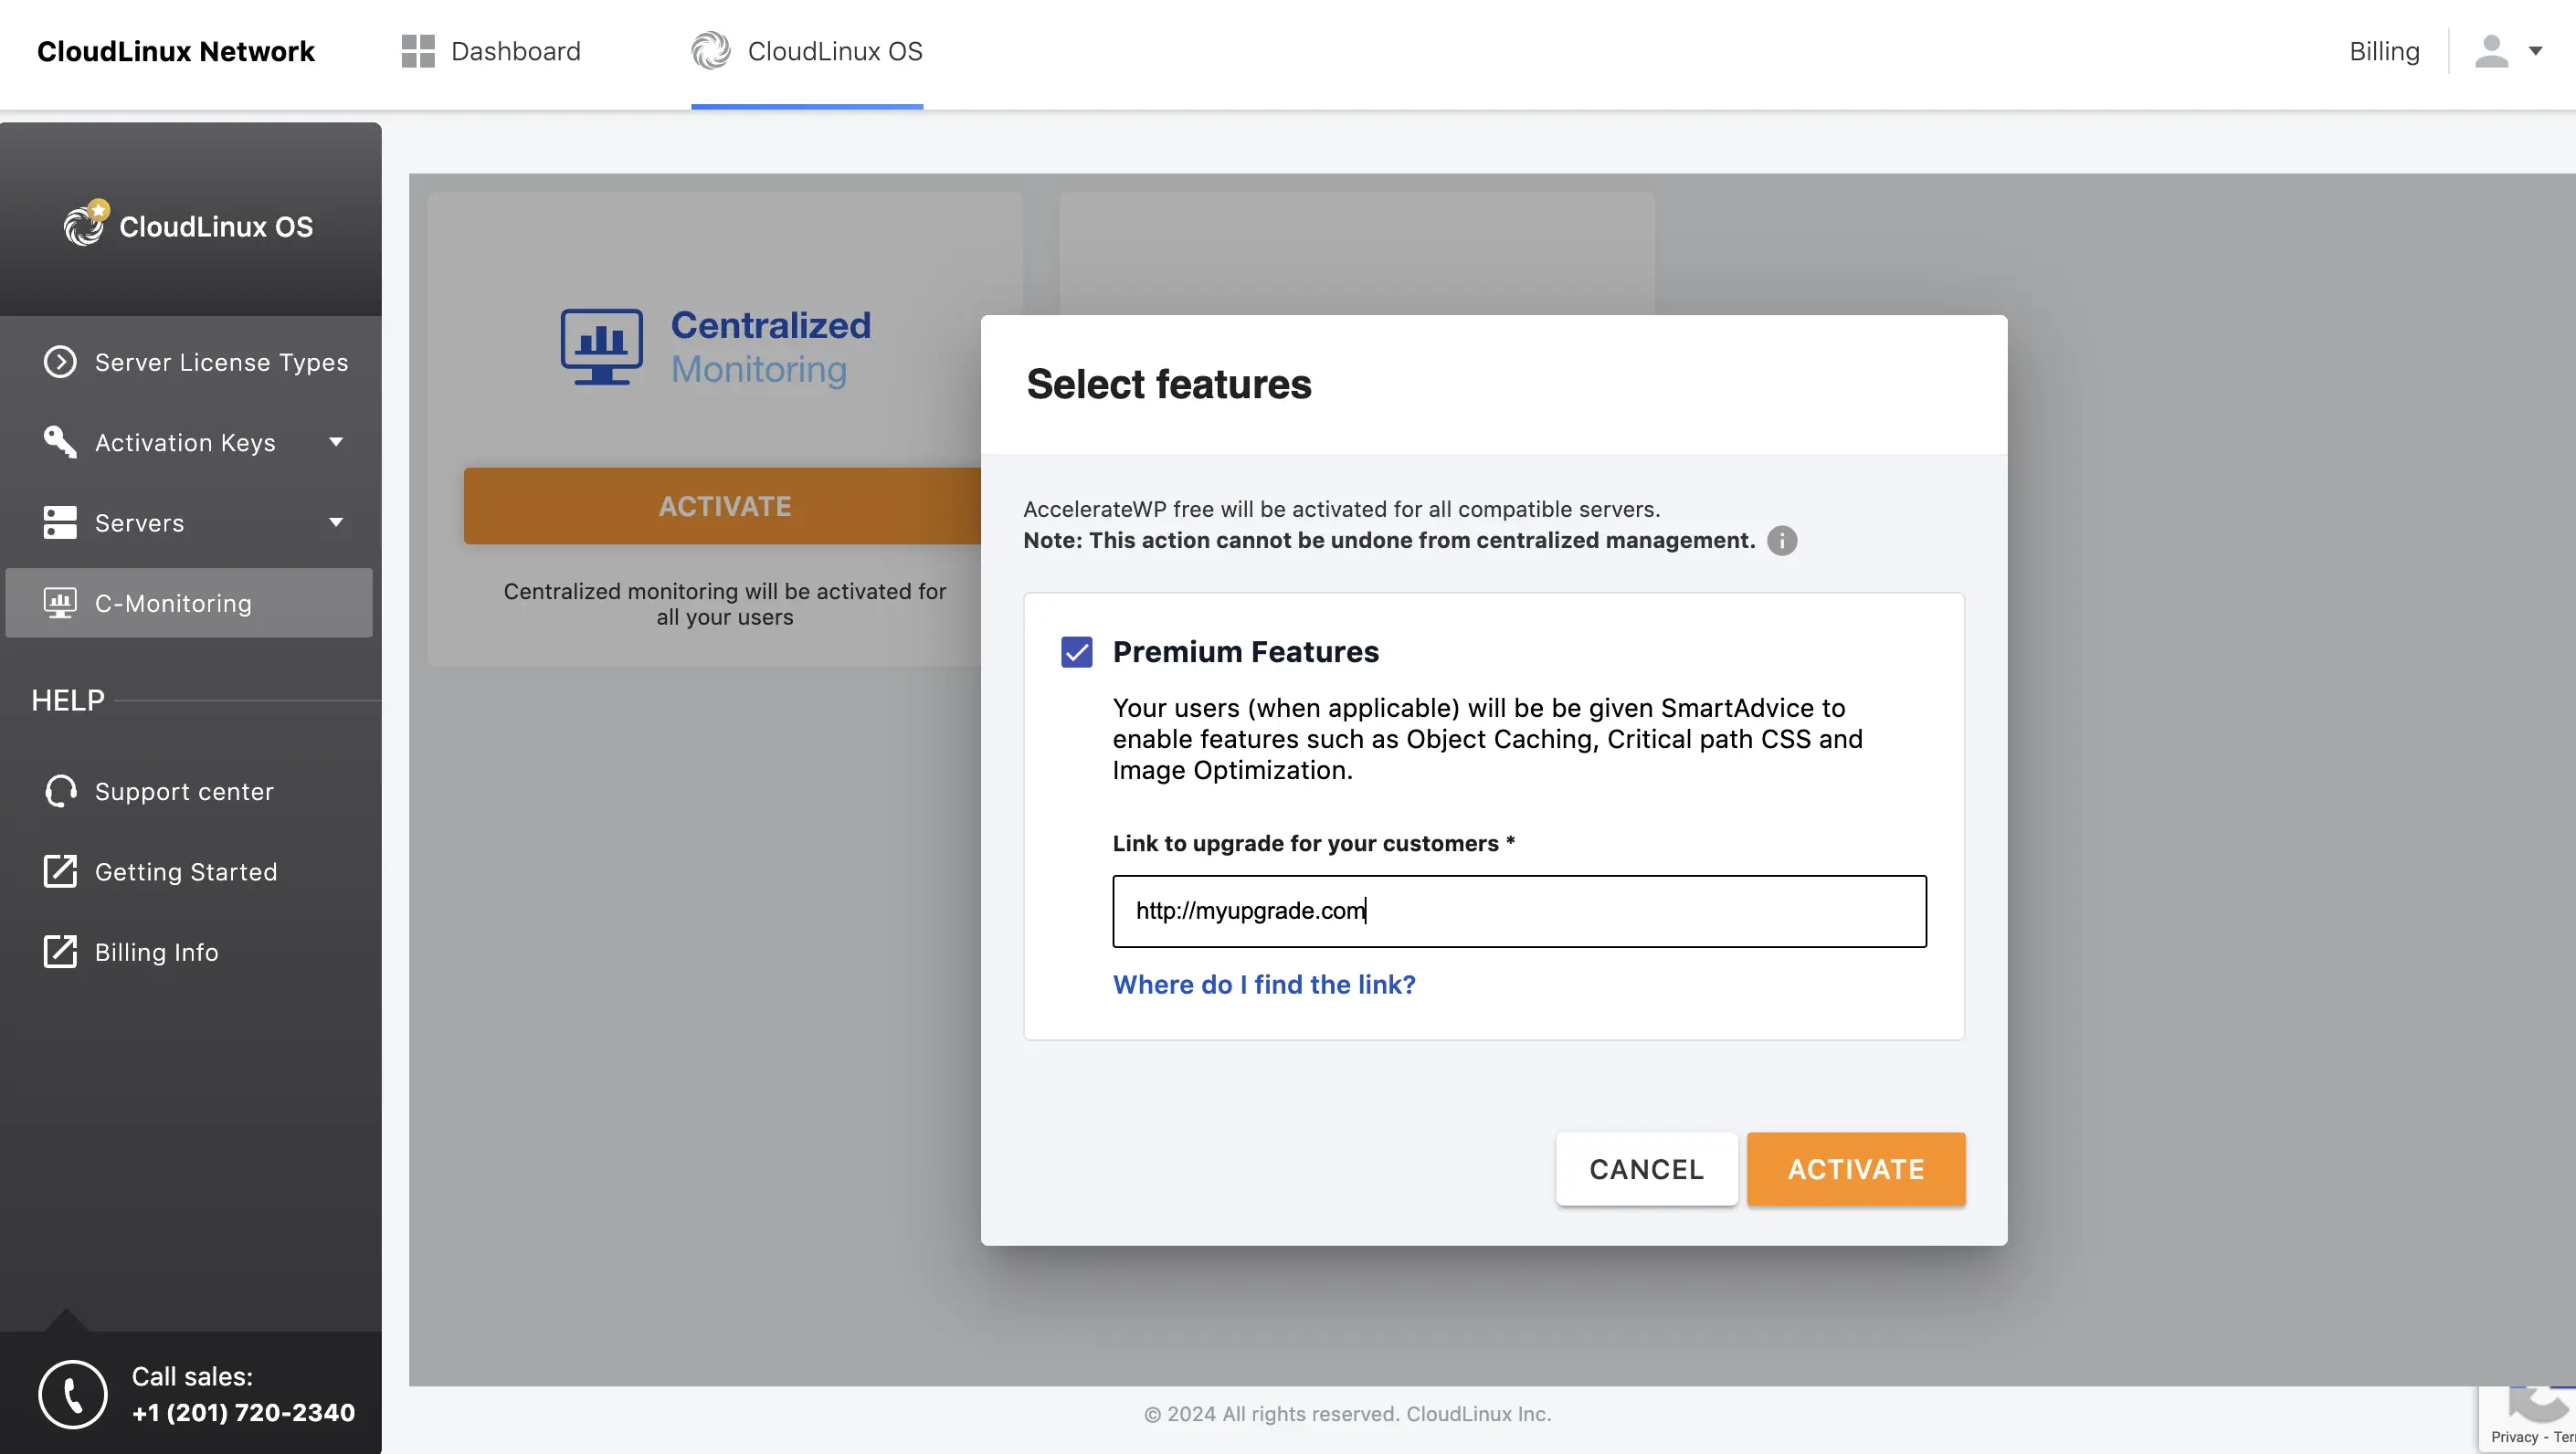
- Within couple minutes after the activation, statistics collection and sending to the central server, AccelerateWP Free* and AccelerateWP Premium * will be set up automatically: all required packages and components will be installed. For new, just registered servers, actions can take up to 5 hours.
- Make sure you have activated statistics collection (see paragraph 4) otherwise you will not be able to set up your servers. For instant set up of a registered server after statistics collection was enabled, run the following commands for all servers:Note: If the
rhn_check /usr/share/cloudlinux/cl_plus/manage_clplus enablerhn_checkcommand is not found, run the following command:AccelerateWP Premium activation support was added inyum install/update rhn-check rhn-setuplve-utils-6.5.11-1. - After 5 hours (or after the manual setup), check that statistics for all registered servers is collected via https://cm.cloudlinux.com/#/servers. And check that user statistics on the servers is collected via https://cm.cloudlinux.com/#/users.
Note
User statistics will be available only for users that were loaded starting from connecting the server to the Centralized Monitoring.
* AccelerateWP Free activation also automatically installs and configures Autotracing on server.
Centralized Monitoring: mode without session expired
Users can monitor server’s or user’s load for a long time using the mode without session expired.
To turn on the mode without session expired, follow the next steps:
Log in to the cln.cloudlinux.com via your account
Open the cm.cloudlinux.com in a new browser tab/window (please, use the same browser as in step 1)
Use the toggle to turn on/off 10 min auto logout

Your session in the cln.cloudlinux.com will expire in 10 min. But your session in the cm.cloudlinux.com will not expire while your browser tab remains open.
Centralized Monitoring user interface
You can access Centralized Monitoring in your CLN account. Click C-Monitoring in the left menu.
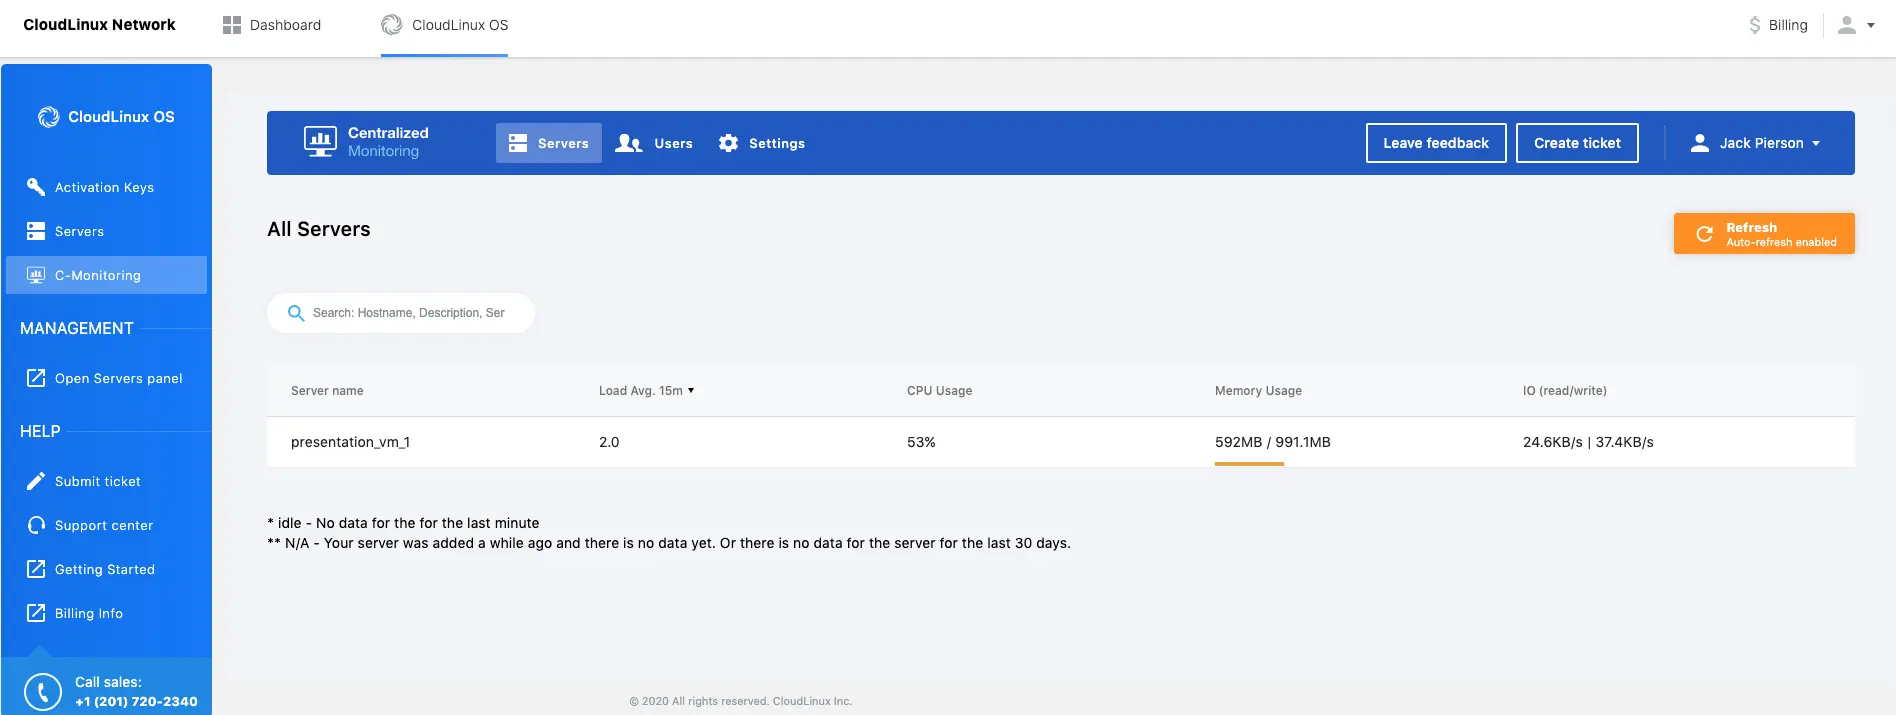
Servers
This page contains the list of all clients’ end servers. The server appears in the list after finishing Installation. By default, there is a descending sort by CPU usage.
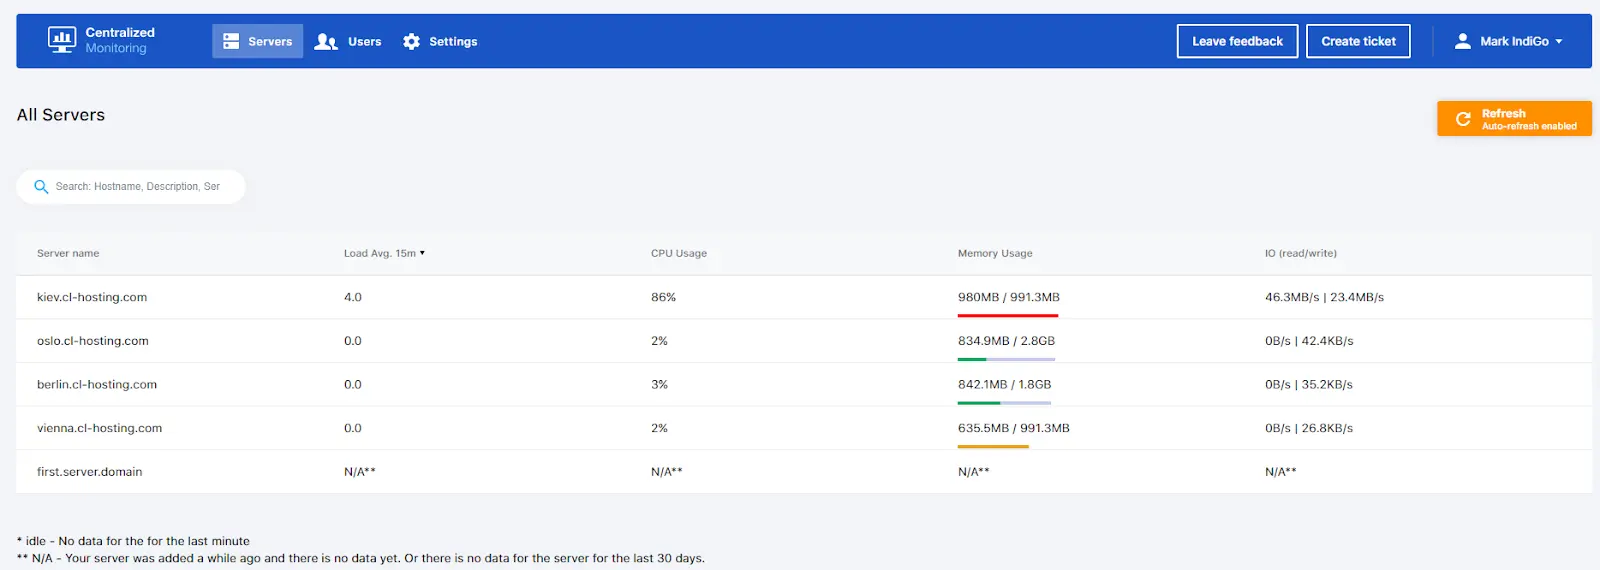
The following values are available for each server:
- Load Avg 15m – average system load for the last 15 min
- CPU Usage – CPU usage for the last 15 min (the number of cores can be found in the hint)
- Memory Usage – free available memory, the second value is the total memory for the last 15 min
- IO read/write – disk read bytes/disk written bytes for the last 15 min
Note
The values are calculated using a 15 min time period but the metric state is updated automatically every minute by default or you can choose from one of the predefined periods.
- Idle state – there were no statistics for the server for the last minute.
- N/A state – there were no statistics for the server for the last 30 days. This can happen if a new server was added but statistics sending was not configured.
There is no pagination on the All servers page and all columns can be sorted by absolute value. Use the search tool to operate with the data.
Servers details
To get the detailed statistics for the server via charts, click a desired server line in the table. All charts are auto-refreshed and there is an ability to select the period for metrics data to be updated for the chart.

Note
We store the metrics data for one month only.
Charts for server metrics
Visualization of the most popular server states
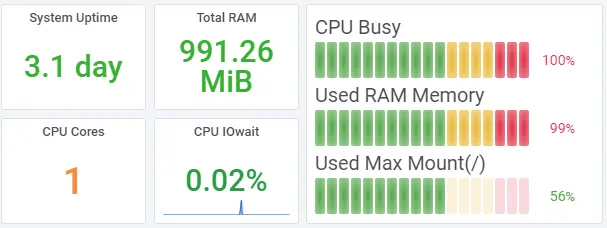
Disk space usage
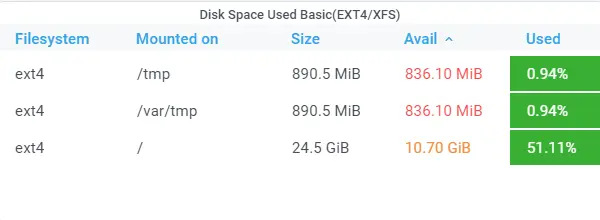
Open file descriptor/Context switches
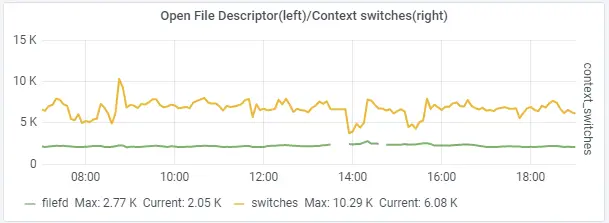
System load 1m , 5m, 15m
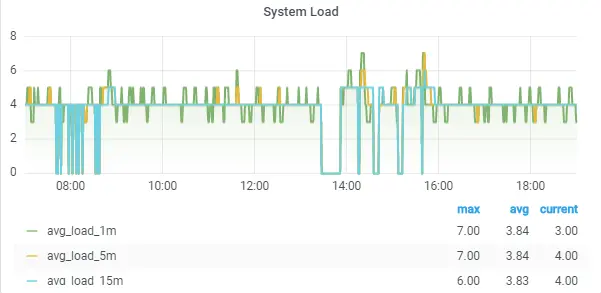
CPU usage (total, system, user, iowait, steal)
Network traffic usage
Disk space usage
Memory usage (total, used, available)
Time spent doing I/Os
Disk IOps Completed
Disk read/write data
Disk read/write time
Apache connections (number)/Number of requests per minute/Max connections
Note
In the current version, we collect these metrics for the cPanel end servers only. We are planning to add other panels support soon.
Note
In the current version, we collect these metrics only for Apache (NOT for LiteSpeed, Nginx, etc.). The charts will be empty for LiteSpeed, Nginx, etc..
MySQL queries
MySQL queries collector gets number of queries executed on the server per minute. It takes data from the MySQL server variable "Questions". You may manually check variable value by executing query SHOW GLOBAL STATUS LIKE 'Questions';. For more information about MySQL server variables - please, see MySQL documentation.
The most loaded server users for the last minute
We calculate the user’s load by LVE statistics that we collect on the end server. The idle state for the user means that the LVE statistics were not collected for the last minute for some reason.
In each cell there are current usage/limit values for the basic LVE limits:
- CPU Usage
- Entry Processes
- Physical Memory Usage
- IOPS
- IO Usage
- Number of Processes
- MySQL CPU
- MySQL IO
In the hint, there is a number of faults for each limit. The values in the columns are underlined (it is red if load-to-limit ratio >=90% and it is yellow if load-to-limit ratio >= 50%). For the current implementation, the only sort by the load-to-limit ratio is available. By default, there is a descending sort by the CPU usage column.
When sorting by a column, the lines with the load-to-limit ratio >=90% for this column will have the red background color, and lines with the load-to-limit ratio >=50% for this column will have the yellow background color.
Note
The users with unlimited resources (∞) will be at the bottom of the table.
Users
This page contains all users for the all server of the client and their LVE statistics for the last minute. You can select the number of users on this page and search by user’s data.
The description of this page is the same as The most loaded server users for the last minute of the top 5 loaded users.
User’s metrics data can be sorted by the load-to-limit ratio and by the absolute value.
The absolute value is used to analyse the load produced by unlimited users.
The value of the load-to-limit ratio is convenient to use in the analysis of how many resources the users consume and whether they need to change the limits.
The values like this  means that the resource is unlimited and 500.2 MB is the current usage of it.
Metrics data of Idle users is not used in the sorting, so such users always will be at the end of the list. The sorting can be done for only one metric.
Charts for Users metrics
Note
We store the metrics data for one month only.
On the user details page, the admin can find the charts for all LVE limits.
Alert Manager
Alert Manager allows you to create a server or user alert for selected metrics and email the triggered events.
Alert Manager page
The Alert Manager page contains a table with the following:
- Alert name - a unique alert name
- Tracking metric - a name of a server/user metric which will trigger the alert notification
- # of servers - number of servers on which the metric will be tracked
- click
 to view a list of servers host names
- click
- # of users - number of users for which the metric will be tracked
- click to view a list of users names
- click
- Value - a condition for the alert rule which will be applied to the tracking metrics
- Email - email to send the triggered events notifications
- Type - a type of the alert rule
- # of triggered events - the number of events from the time, when alert rule was created
 the event is still firing
- Time of the last trigger - the time of last triggered event, it is the time in your browser time zone
- Actions - click
 to edit and
  to delete the alert rule
Color Codes
- Red color means that the event with the condition "more than" is still firing.
- Green color means that the event with the condition "less than" is still firing.
Creating an alert
To create a new alert, click the Create alert button.

Next, fill out the opened popup.
- Name of alert - a unique alert name
- Alert type - an admin can create a user or a server alert. What is the difference between them?
- Select user/server - admin will see such dropdown depending on a case of alert creating
- Notify me - the condition of the alert trigger
- Duration - how much time the condition should be actual to trigger the notification
- Notify me on email - the email to send notifications
Editing an alert
An admin can edit any field in the Alert except the Alert type.
Difference between the server alert and the user alert
The server alert is used to track the state of the whole server, it does not track user state on the server. The server alert tracks the next list of metrics:
- Context switches
- System load (1m)
- System load (5m)
- System load (15m)
- CPU Basic (total)
- CPU Basic (system)
- CPU Basic (user)
- CPU Basic (iowait)
- CPU Basic (steal)
- Network Traffic Basic (
eht0_receive) - Network Traffic Basic (
eht0_transmit) - Network Traffic Basic (
ehtN_receive) - Network Traffic Basic (
ehtN_transmit) - Disk Space Used Basic (
mountpoint: <0>) - Disk Space Used Basic (
mountpoint: <1>) - Disk Space Used Basic (
mountpoint: <N>) - Memory Basic (available)
- Memory Basic (used)
- Time spent Doing I/Os
- Disk IOps Writes Completed
- Disk IOps Reads Completed
- Disk Read Data
- Disk Write Data
- Disk Read Time
- Disk Write Time
- Apache connections
- Number of requests per minute
- MySQL queries
- Hardware Temperature (
chip<0>) - Hardware Temperature (
sensor<0>) - Hardware Temperature (
chip<N>) - Hardware Temperature (
sensor<N>) - Open File Description
During creating a server alert an admin should select the type of metrics as the first step. The list of servers will be collected according to the availability of these metrics on the server.
For example, for now, we do not collect Apache metrics for non-cPanel servers, so you will get only cPanel servers as a list of servers for these metrics.
We're planning to implement support for other panels/web servers in the next releases.
Small limitation
We collect the server list according to having their statistics in our database (this behavior will be changed in the next releases).
For example, if server state is N/A or idle more than 24 hours, it will not be visible in the list for the alert.
The user alert tracks the next list of LVE metrics:
- CPU Usage (current usage)
- CPU Usage (faults)
- Entry Processes (current usage)
- Entry Processes (faults)
- Physical Memory Usage (current usage)
- Physical Memory Usage (faults)
- IOPS (current usage)
- IOPS (faults)
- IO Usage (current usage)
- IO Usage (faults)
- Number of Processes (current usage)
- Number of Processes (faults)
- MySQL CPU (current usage)
- MySQL CPU (faults)
- MySQL IO (current usage)
Small limitation
We collect the server list according to having their statistics in our database (this behavior will be changed in the next releases).
For example, if the user state is N/A or idle more than 24 hours, it will not be visible in the list for the alert.
Cases of alert creating
- Creating a server alert for the selected metrics for one server
- Creating a server alert for the selected metrics for all servers (the default value)
In this two cases, you will not see the dropdown for selecting users because the metrics will track the server state.
- Creating a user alert for one user, so admin can select a server and a user.
- Creating a user alert for all users on several servers/all servers (in this case admin can't select users - all users will be selected automatically)
What is the Firing state of the alert?
This is the state of an alert that has been active for longer than the configured threshold duration.
Alert notifications
- Alert name - the link to the alert page
- Firing target - the link to the server details page
FAQ
How can I disable collecting and sending statistics on a client’s server?
Run this command:
/usr/share/cloudlinux/cl_plus/manage_clplus disable
Where can I view all my servers load?
You can find all your servers load in your CM personal account here: https://cm.cloudlinux.com/#/servers or in your CLN personal account here: https://cln.cloudlinux.com/console/cloudlinux/centralized-monitoring.
Where can I view all my users load?
You can find all your users load in your CM personal account here: https://cm.cloudlinux.com/#/users or in your CLN personal account here: https://cln.cloudlinux.com/console/cloudlinux/centralized-monitoring
Where can I view a server load details for a period?
Click the desired server in the server list in the UI.
Where can I view a user load details for the period?
Click the desired user in the user list in the UI.
How long are statistics stored in the central database?
30 days.
How can I change the charts period on the details page?
Choose the desired period in the upper right corner or select it directly on the chart.
I don’t understand how to read the user load chart.
The user load chart contains three lines:
- limit
- current load
- count of faults
Limit and current load are drawing regarding the left vertical axis, the count of faults is drawing regarding the right vertical axis. You can focus on a particular line by clicking a required legend.
Troubleshooting
I can't see a server statistics
- Check that your server is registered by key or by IP license of the CloudLinux+ account, i.e., it should be seen in the list of servers in your CLN account here: https://cln.cloudlinux.com/console/auth/login
- Check that the following required packages are installed on the end server:
cl-end-server-tools>= 1.0.7-1cl-node-exporter>= 1.1.0-2rhn-client-tools- CloudLinux OS 6 >= 1.1.15-3.el6.cloudlinux.26
- CloudLinux OS 7 >= 2.0.2-31.el7.clouldinux
- CloudLinux OS 8 >= 2.8.16-14.module_el8.1.0+6074+9dc6073e.cloudlinux.2
lve-stats>= 3.0.7-2lve-utils>= 4.2.21-2alt-python27-cllib>= 2.1.13-1lvemanager>= 6.2.10-1
- Check that service collecting and sending statistics is running:
service cl_plus_sender status
- Check that log of the cl_plus_sender service doesn't contain errors:
/var/log/clplus_sender.log
Where can I view the events log on the client's server?
You can view the events log on the client's server here:
/var/log/clplus_sender.log
Can I get monitoring metrics from LiteSpeed, Nginx or other (Not Apache) web server?
Starting from end-server-tools-1.0.7, it supports collecting and sending statistics from the Apache and LiteSpeed web servers.
LiteSpeed is supported on cPanel and DirectAdmin control panels.
Each minute the statistics collection daemon checks which web server is started. If LiteSpeed is started, the daemon will collect data from it, otherwise, it checks if Apache is started.
When the daemon detects that the server is changed, it writes the following line into the statistics collection daemon log /var/log/clplus_sender.log:
2020-10-09 17:25:31,462: (CL+_sender_daemon) [INFO] Apache/Litespeed collector: Using Apache
or
2020-10-09 18:13:03,897: (CL+_sender_daemon) [INFO] Apache/Litespeed collector: Using Litespeed
If the daemon can't detect either Apache or LiteSpeed, it writes to the log the following:
2020-10-09 17:33:38,399: (CL+_sender_daemon) [INFO] Apache/Litespeed collector: Apache or Litespeed stopped or absent, collector will not work
The statistics collection daemon reacts to the server changing automatically, no need to restart it.
Warning
Please note that the daemon checks the server type once in a minute, so the data sent on a minute of switching can be unreliable.
Logging data sent to pushgateway to the statistics collection daemon log
Starting from cl-end-server-tools v.1.0.6-1, the statistics collection daemon allows to log data sent to pushgateway to its log /var/log/clplus_sender.log.
To start logging, run the following command:
touch /var/lve/cmt_debug_logging
To stop logging, run the following command:
rm -f /var/lve/cmt_debug_logging
You don't need to restart the daemon after starting/stopping logging. The presence of a control file is evaluated "on the fly".
Warning
Use this logging with caution because when it is enabled, the size of the daemon log /var/log/clplus_sender.log will increase each minute minimum on 3-4 KB. The actual increase size depends on the number of active users' processes on a server.
Known issues
- MySQL Governor statistics in some cases is collected incorrectly
- Sorting by MySQL Governor statistics ignores idle users
- Sorting from the search result set does not work
- Sorting by ratio for unlimited users works incorrectly
X-Ray
Description
Warning!
X-Ray is available out of the box for cPanel, Plesk, and DirectAdmin. For other control panels you should implement integration as described here
X-Ray is a tool developed for website performance monitoring and performance issues detection.
X-Ray can gather and visualize information about top N slowest system functions, external requests, software modules and database queries of the client’s website.
Known limitations
X-Ray is not compatible with Opcache JIT optimization. Once X-Ray tracing task is running for the site the Opcache JIT optimization will be disabled until tracing task completed.
Installation
Note
X-Ray Autotracing is installed and enabled by default on all new compatible servers.
Make sure you have CloudLinux OS Shared Pro subscription (only non-reseller accounts apply)
Make sure you have installed LVE Manager version 6.2 or later. You can install or update it with the following commands:
- installation
yum install lvemanager- update
yum update lvemanagerX-Ray will be activated on all your servers during 4 hours. You will see the X-Ray tab in the LVE Manager UI.
For instant activation, run the following command:
rhn_checkIf the
rhn_checkcommand is not found, run the following command:yum install rhn-check rhn-setupThen install the
alt-php-xraypackageVia user interface
- Go to the X-Ray tab.
- Click Install to start installation.
Via SSH by running the following command:
yum install lvemanager alt-php-xrayAfter installation, use the Start tracing button to create your first tracing task for a slow site.

X-Ray serverwide mode
With X-Ray v0.6-11 we introduced global X-Ray mode which enables tracing extension for all PHP versions on the servers. This mode allows your customers to override PHP versions in different folders and trace websites located in those folders.
In order to enable this mode, type the following command:
cloudlinux-xray-manager enable-serverwide-mode
In order to get back to default:
cloudlinux-xray-manager disable-serverwide-mode
Enable and disable commands do not stop or remove tracing tasks.
X-Ray phpinfo mode
With X-Ray v0.6-18 we introduced new X-Ray mode which gathers website php version using information from phpinfo. This mode allows your customers to override PHP versions
In order to use this mode, websites should be reachable through http or https.
In order to enable this mode, type the following command:
touch /opt/cloudlinux/flags/enabled-flags.d/xray-per-domain-php-version-mode.flag
In order to get back to default:
rm -f /opt/cloudlinux/flags/enabled-flags.d/xray-per-domain-php-version-mode.flag
How to manage X-Ray
X-Ray provides several options for monitoring domain requests speed: Manual Tracing task, X-Ray Autotracing and Continuous tracing.
Manual Tracing task is a task that you can create for a specific URL to collect server requests. The task will end either after a specified number of requests to the URL or after a specified time (maximum after two days). It is not possible here to automatically email a report but it is possible to export the report in PDF and send to a user.
Autotracing task is a task that will be created automatically at the end of each day for slow URLs that were found during that day by the PHP Slow Site Analyzer (SSA). Need to be enabled separately, see How to enable X-Ray Autotracing.
Continuous tracing is a task that initiates daily hourly tracing requests for a specified domain and email a monitoring report. Continuous task can't stop automatically, you need to stop it manually. In fact, continuous task allows to automatically create a tracing task for each new day, with the ability to get a report for the past day.
Tracing tasks tab
The Tracing tasks tab contains a list of all tracing tasks created both manually and automatically via continuous tasks.

The Created column shows how a task was created – automatically (by continuous task) or manually.
Continuous tracing tab
Warning
To use Continuous task, update your LVE Manager and alt-PHP-X-Ray packages to versions lvemanager-6.2.9-1 and alt-php-xray-0.2-1 by running the following command:
yum update lvemanager alt-php-xray
The Continuous tracing tab contains a list of continuous tasks for which tracing tasks will be created automatically for a new day for a specific domain.
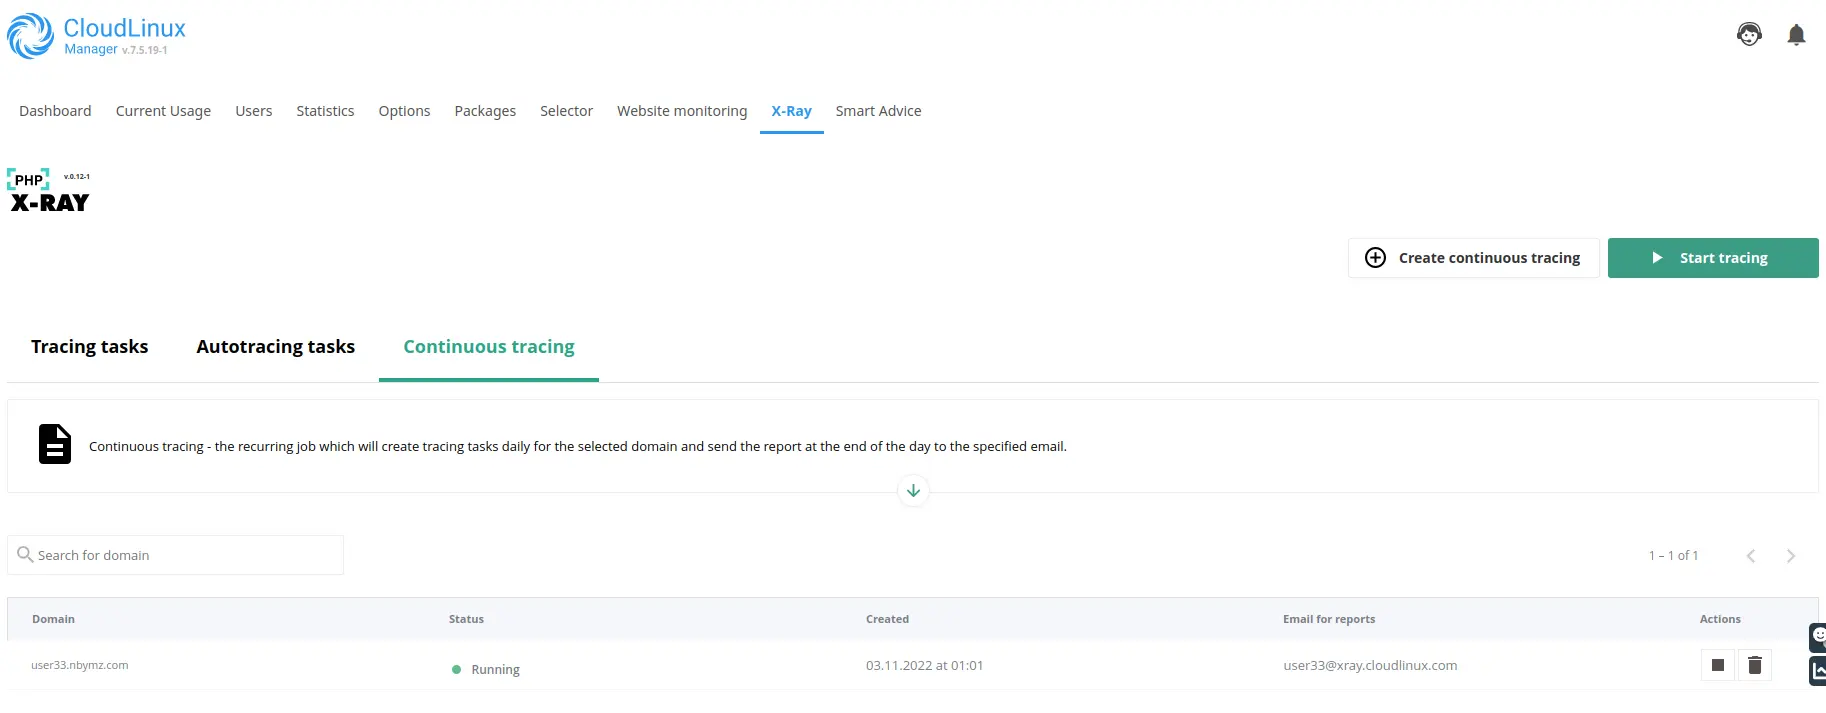
Managing tracing task
Creating a new tracing task
- Go to the X-Ray tab
- Click the Start tracing button to create a new task
- In the opened popup specify a website URL to trace
- Click the Run button
- Tracing will run in the default mode. In the default mode X-Ray traces the first 20 requests for a specified URL
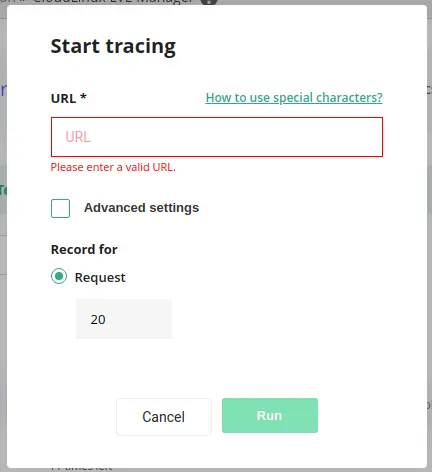
URL should be a valid URL of the domain which exists on the current hosting server. The URL field supports wildcard matching. To learn more about wildcard matching, click How to use special characters.
Advanced settings allow you to set an IP address and tracing options: by time or by number of queries.
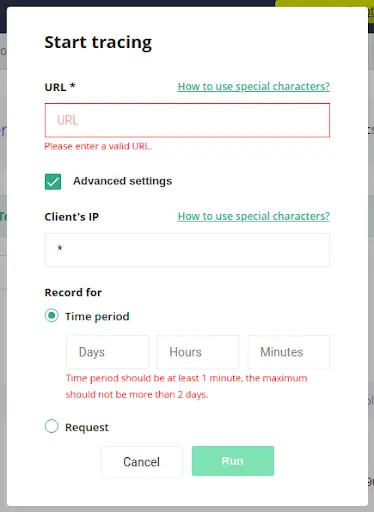
Advanced settings
- Client’s IP: it is an IPv4 address of a machine to trace. For example, if you have a production website that processes requests from different IP addresses and you do not want to add these requests to the tracing task. So, you can set a specific IP address and X-Ray will analyze requests only from this specific IP address. Record for
- Time period: how much time X-Ray collect the requests (2 days max)
- Requests: the amount of requests that X-Ray will collect
After creating, the task appears in the list of tracing tasks.
Viewing tracing tasks list
Tasks created Manually are simply tracing tasks.
Tracing status
A tracing task can have the following statuses:
- Running – tracing is in progress
- Stopped – tracing was stopped by administrator
- On hold – the same URL already exists in the lists. Task processing will not start automatically. Administrator should start it manually.
- Completed – period of time is finished or number of requests is reached.
Collected requests for tracing task
Warning!
Collected requests are available in the UI for 30 days.
Click  to open a list of collected requests.
Tracing tasks
The slowest request is highlighted.

- Total displays how many requests were collected according to tasks requirements.
- Pending displays how many of collected requests are not visible in the table yet.
- Throttled displays the number of requests during the execution of which the LVE limits were exceeded.
- Slow displays the number of requests lasting more than one second.
There are filters for the request types and the indicator of a filter used now.
If slow requests were not detected during the tracing task, the following is displayed. Here, you can also view all requests.
X-Ray collects the following data for each request:
- Top issues – the slowest items of a request
- Software modules/plugins by execution time (only for WordPress plugins)
- Database queries by execution time
- External requests by execution time
- Other system functions by execution time
Software modules/plugins
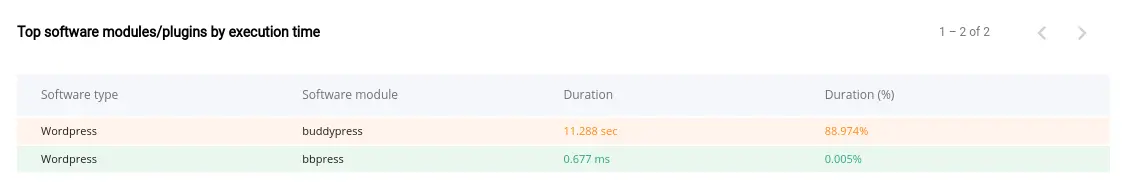
The Software modules/plugins section displays the following data:
- Software type – a type a module/plugin. For now, X-Ray can analyze only WordPress software
- Software module – a name of the WordPress plugin
- Duration – plugin execution time
- Duration (%) – plugin execution time as a percentage of the total duration of the request
Database queries
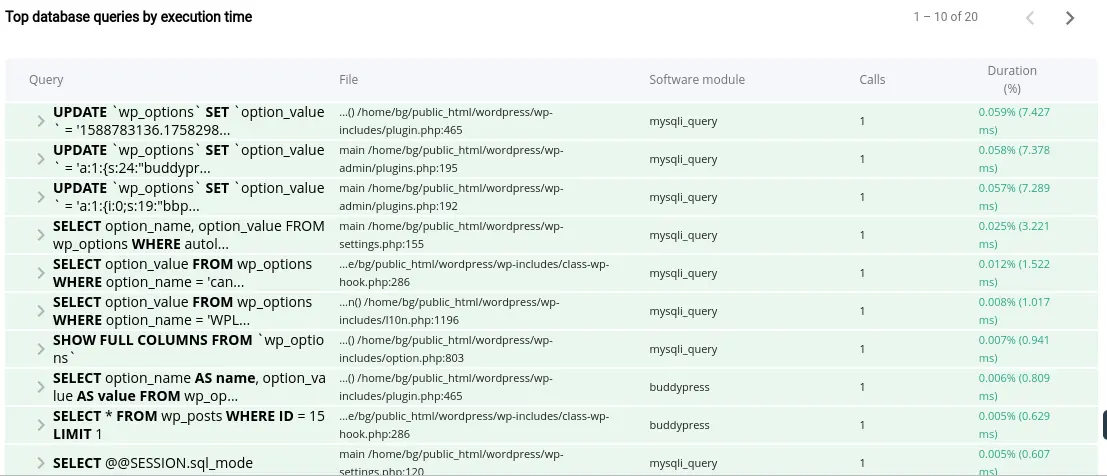
The Database queries section displays the following data:
- Query – the executed SQL-query
- File – the file and the line of the executed query and backtrace
- Software module – a WordPress plugin name from which the request was completed. If the request does not belong to any of the WordPress plugin, the name of the function that executed the given request is displayed
- Calls – the number of identical SQL queries
- Duration – execution time as a percentage of the total duration of a request and the function processing time (in brackets)
External requests
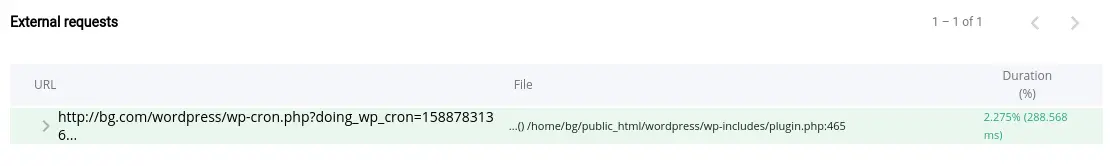
The External requests section displays the following data:
- URL – the URL of the executed request
- File – the file and the line of the executed request and backtrace
- Duration – execution time as a percentage of the total duration of a request and the function processing time (in brackets)
System functions
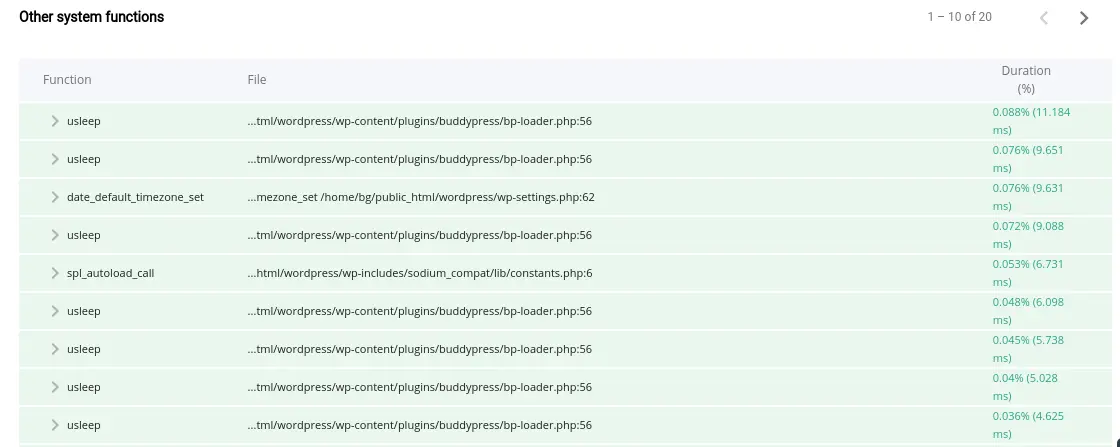
The System functions section displays the following data:
- Function – the executed function
- File – the file and the line of the executed request
- Duration – execution time as a percentage of the total duration of a request and the function processing time (in brackets)
Stopping tracing task
Click  to stop the tracing task.

The tracing task status will be changed to Stopped. Data will not be collected anymore but you can see already collected information or continue tracing later by clicking  .
.
Deleting tracing task
Click  to delete the tracing task.
Warning!
When you have deleted a tracing task, all collected data will be unavailable.
Managing continuous tasks
Creating a new continuous task
- Click the Create continuous tracing button
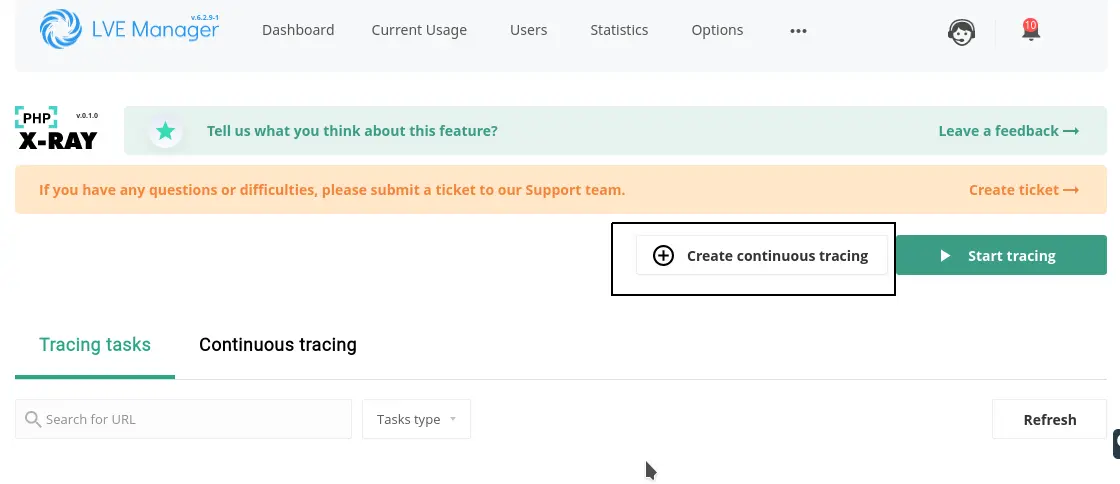
- Specify URL in the Domain field and email in the Email for reports field and click the Create button.
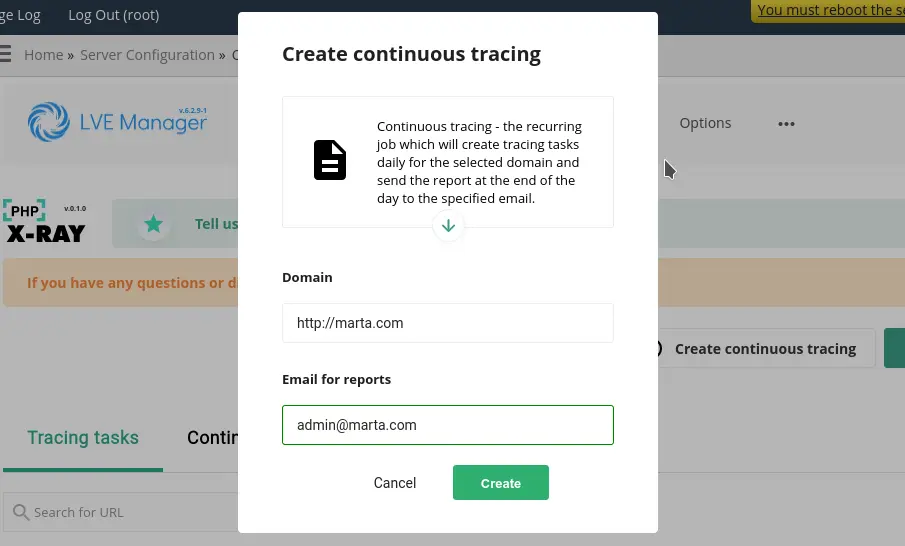
- You can see a new task in the Continuous tracing tab in the X-Ray UI.
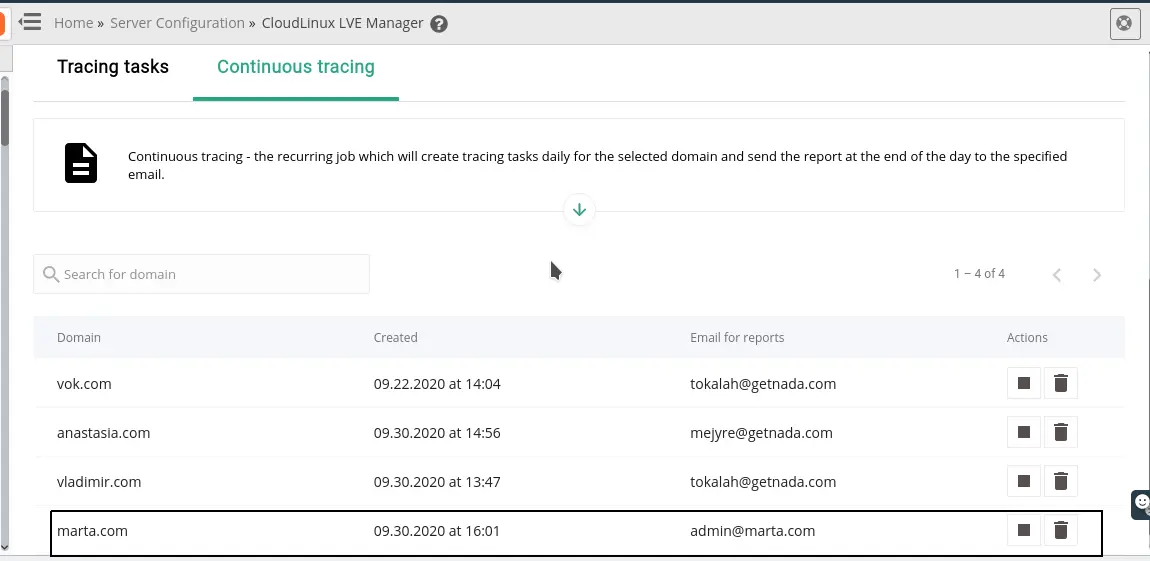
If you stop a continuous tracing task, a new task for the next 24 hours will not be created. The task for the current day will be finished at midnight and the report will be emailed.
If you delete a continuous tracing task, the task for the current day will be finished at midnight and the report will be emailed.
Viewing continuous tasks list
You can find a list of continuous tracing tasks in the Continuous tracing tab.
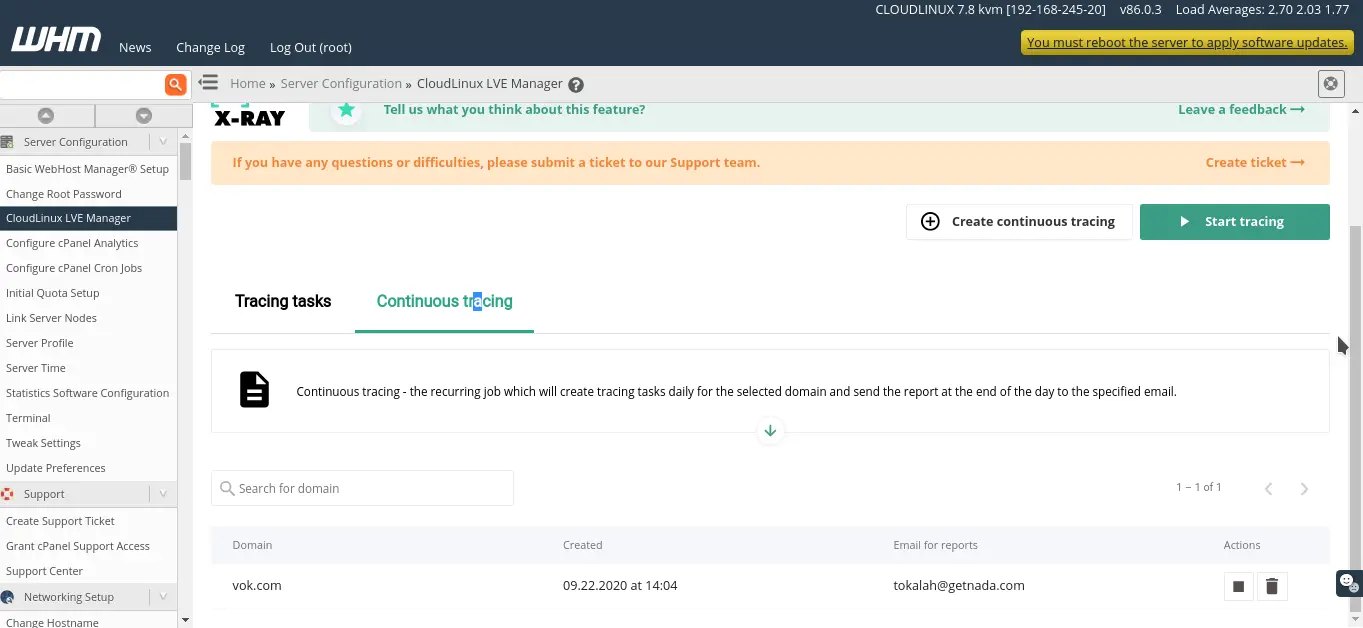
You can find automatically created tasks in the Tracing tasks tab marked as Automatically in the Created column.
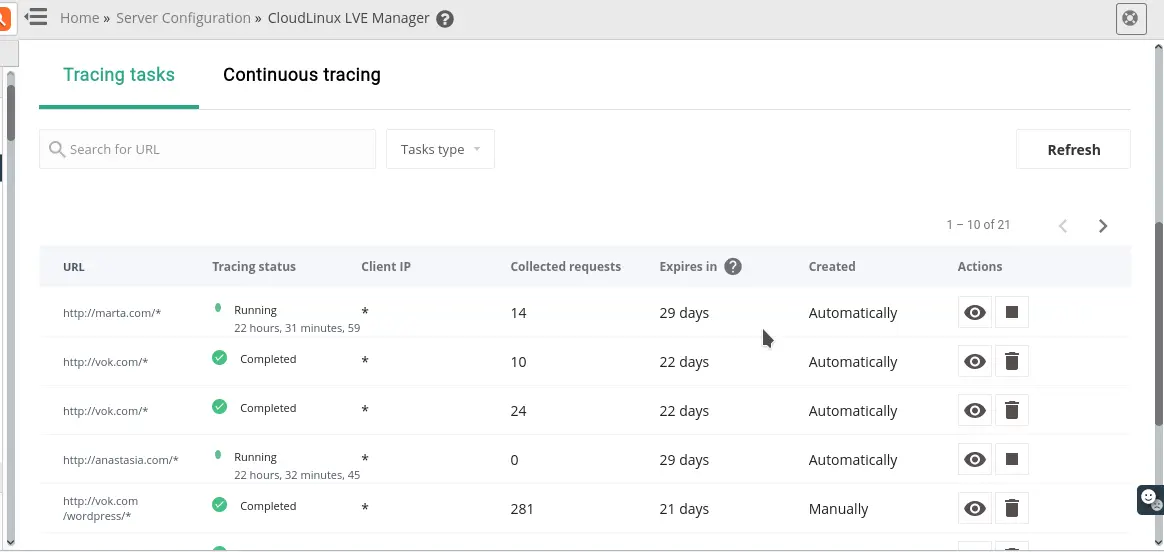
The statuses for automatically created tasks are the same as for tracing task.
To view detailed info about an automatically created task, click  . You will get requests grouped by hour.
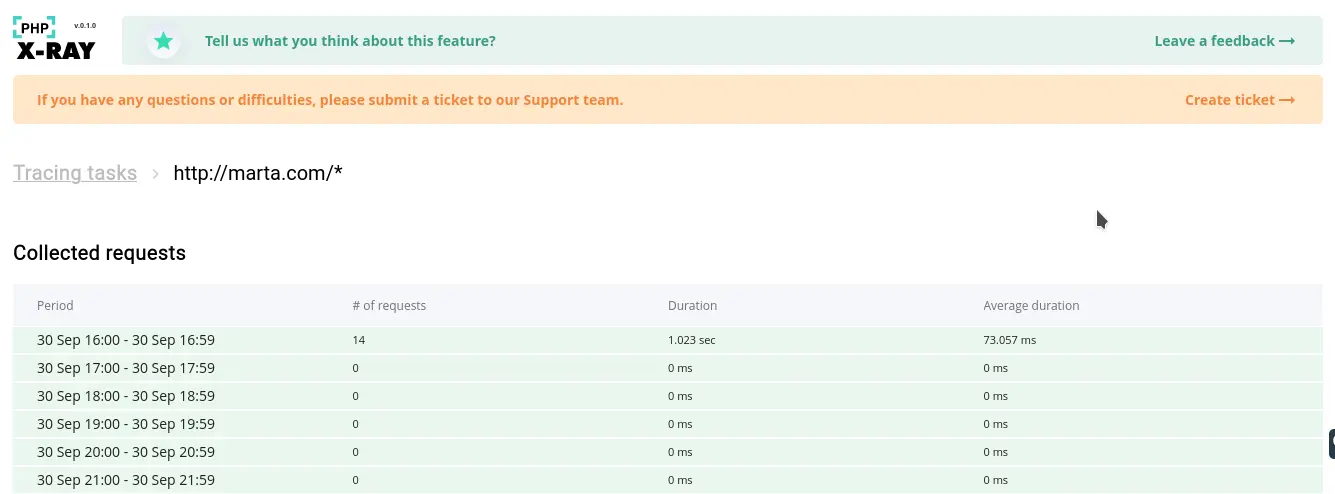
Click to a group to open a list of the requests.
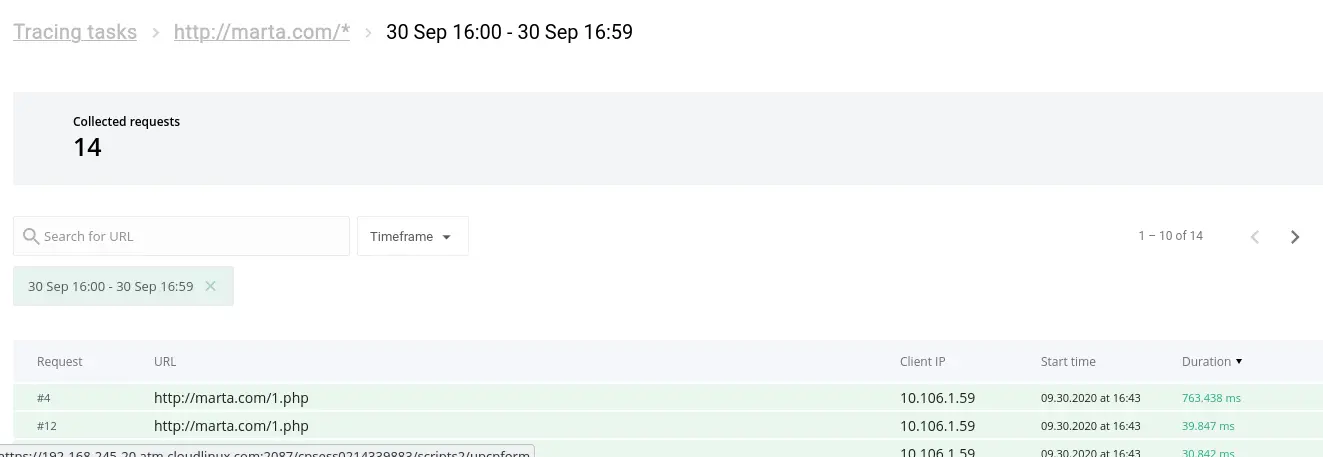
The following data is collected for each request:
- Software modules/plugins by execution time (only for WordPress plugins)
- Database queries by execution time
- External requests by execution time
- Other system functions by execution time
Stopping automatic tracing task
Stopping automatic tracing task (a part of continuous tracing task) affects only the automatic tracing task for the current day. A new task for the next day will be created at the end of the day.
To stop the continuous tracing task completely, see Creating a new continuous task, paragraph 4.
Deleting automatic tracing task
Deleting automatic tracing task (a part of continuous tracing task) affects only the automatic tracing task for the current day. A new task for the next day will be created at the end of the day.
To delete the continuous tracing task completely, see Creating a new continuous task, paragraph 5.
Continuous task daily report
Users get daily reports on their emails. An example of a report is shown below:

Click the link in the email to show the detailed report:
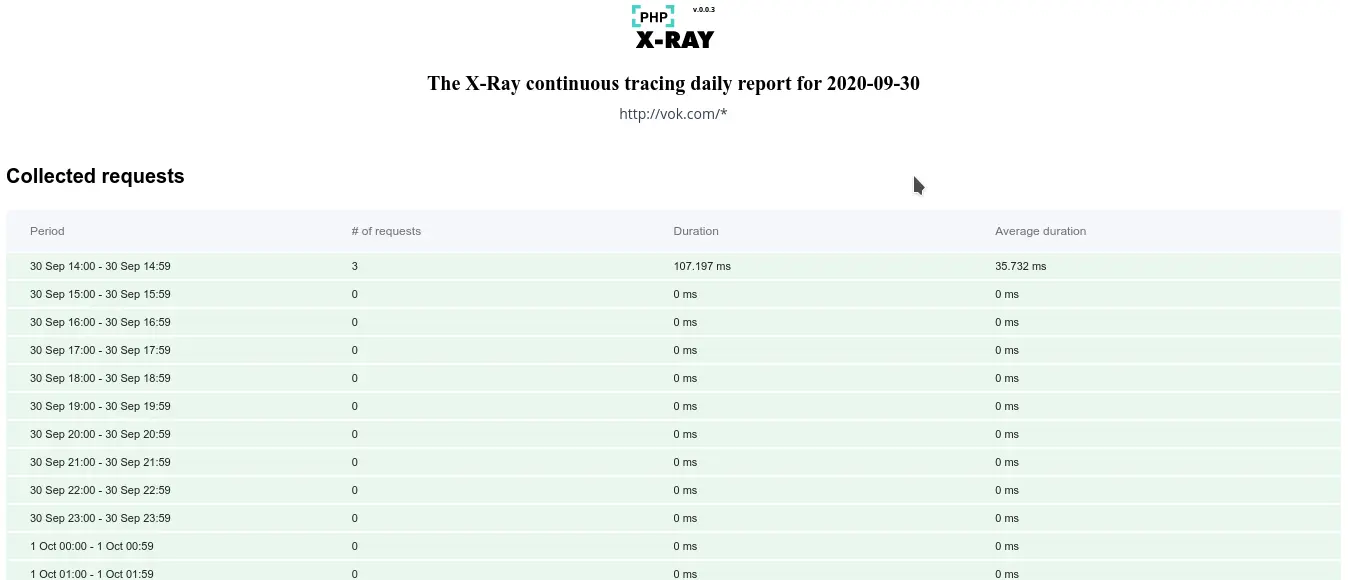
You can view requests grouped by hour:
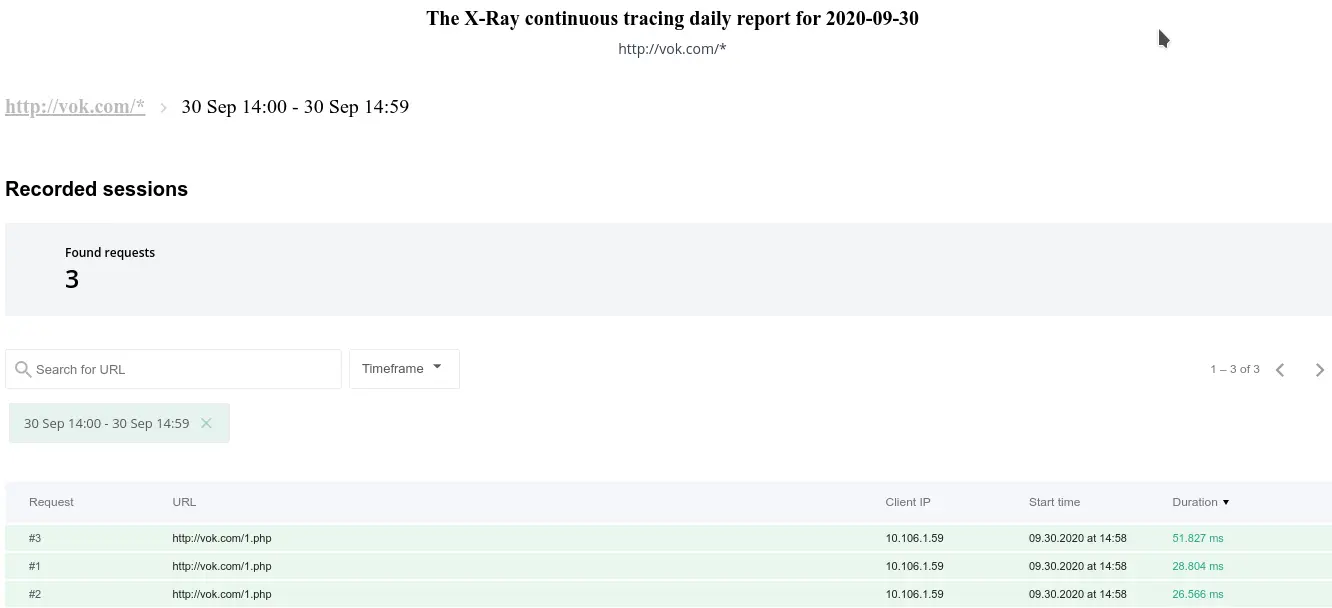
You can also view the detailed information about request:
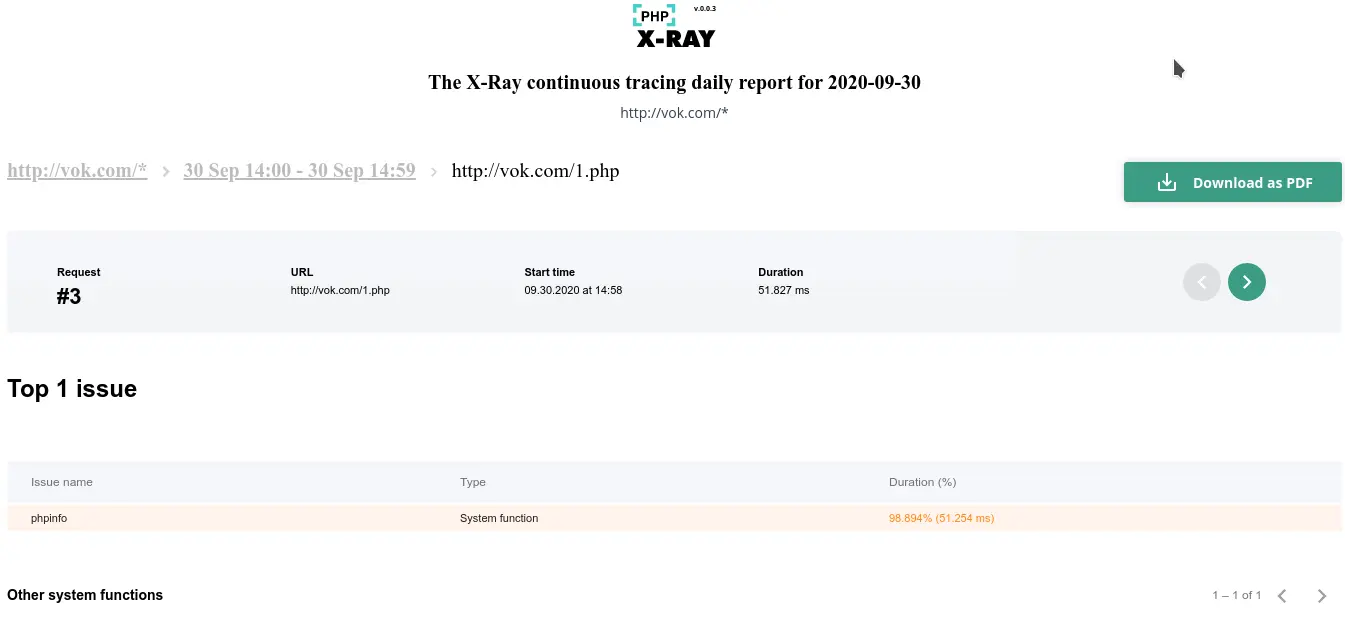
X-Ray Autotracing
X-Ray Autotracing automatically creates tracing tasks for slow URLs that were found during a day by the PHP Slow Site Analyzer (SSA).
Warning
To use X-Ray Autotracing, update your alt-php-ssa and alt-php-xray packages to versions alt-php-ssa-0.2-1 and alt-php-xray-0.4-1 or higher by running the following command:
yum update alt-php-ssa alt-php-xray --enablerepo=cloudlinux-updates-testing
How to enable X-Ray Autotracing
To enable X-Ray Autotracing, run the following commands via SSH:
/usr/sbin/cloudlinux-ssa-manager enable-ssa
/usr/sbin/cloudlinux-autotracing enable --all
Check CLI documentation for a description of the /usr/sbin/cloudlinux-autotracing CLI utility.
Requirements
- CloudLinux OS Shared Pro or CloudLinux OS Solo or CloudLinux OS Admin
- alt-php-ssa > 0.2-1 version
- alt-php-xray > 0.4-1 version
- Enabled PHP SSA on the server
Autotracing Interface
A new tab for Autotracing tasks was added to the X-Ray UI:
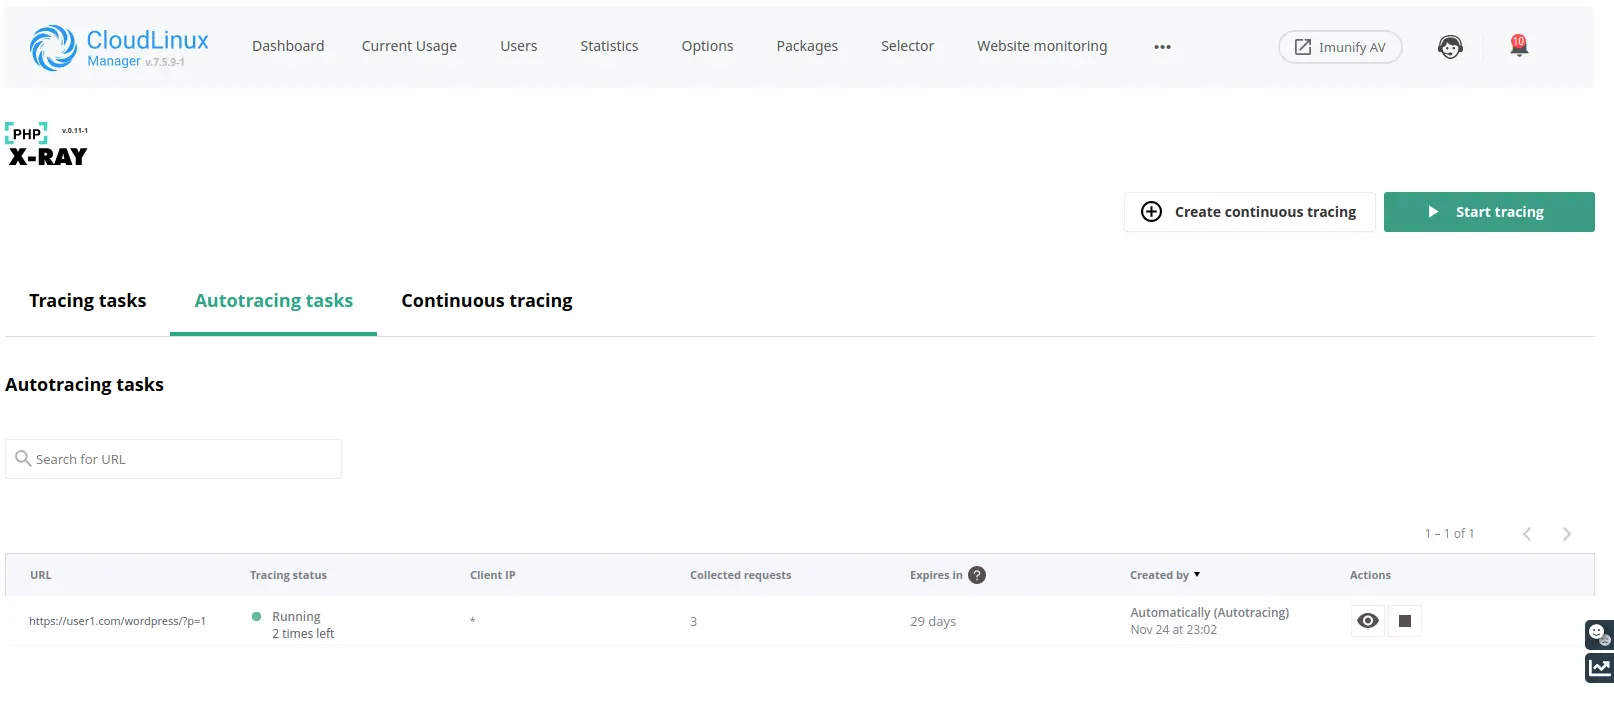
Autotracing FAQ
Q: Why are the slow URLs in the Slow Site Analyzer report different from those on which the autotracing tasks were created?
A: Because the autotracing decision module uses rules and thresholds different from Slow Site Analyzer, which are configured by the CloudLinux team.
Q: How often autotracing tasks will be generated?
A: Once a day at the same time as a Slow Site Analyzer report.
X-Ray Smart Advice
Smart advice is a new feature of X-Ray that is designed to find and propose solutions to fix performance issues and speed up the performance of a sites.
Note
Smart Advice will work only for CloudLinux OS Shared Pro servers with cPanel Control Panel for now.
At the moment, Smart Advise is focused only on WordPress sites.
Warning
To use X-Ray Smart Advice, update your alt-php-ssa and alt-php-xray packages to versions alt-php-ssa-0.2-3 and alt-php-xray-0.5-1 or higher by running the following command:
yum update alt-php-ssa alt-php-xray lve-utils lvemanager --enablerepo=cloudlinux-updates-testing
How to enable X-Ray Smart Advice
Attention!
If you'd like to try Smart Advice and AccelerateWP you should participate in the Beta tester program. To become a beta tester, please send your request at our Beta program page with the signup form here. Once you submit the request, we will send you a confirmation email with program details and terms of use.
Requirements
- CloudLinux OS Shared Pro or CloudLinux OS Solo
- alt-php-xray > 0.5-1 version
- lve-utils > 6.3.2-1 version
- lvemanager > 7.6.1-1 version
- cloudlinux-site-optimization-module > 0.1-1 version
We Recommend:
- Enable X-Ray Autotracing on the server
- Use alt-php-ssa > 0.2-3 version
How X-Ray Smart Advice works
The main process of looking for advice is X-Ray tracing tasks. The best way for doing this is to enable X-Ray Autotracing. This will allow you to most effectively find Smart Advice for sites that have performance issues without your manual participation. You can find information on how to enable X-Ray Autotracing here. On the other hand, you can create tracing tasks manually or use continuous X-Ray but we suggest you use X-Ray Autotracing for this purpose.
Note
Advice will not be generated by old tracing tasks.
While the tracing task is running, X-Ray will look for places where advice can be applied. New advice will be displayed on the Smart Advice tab.
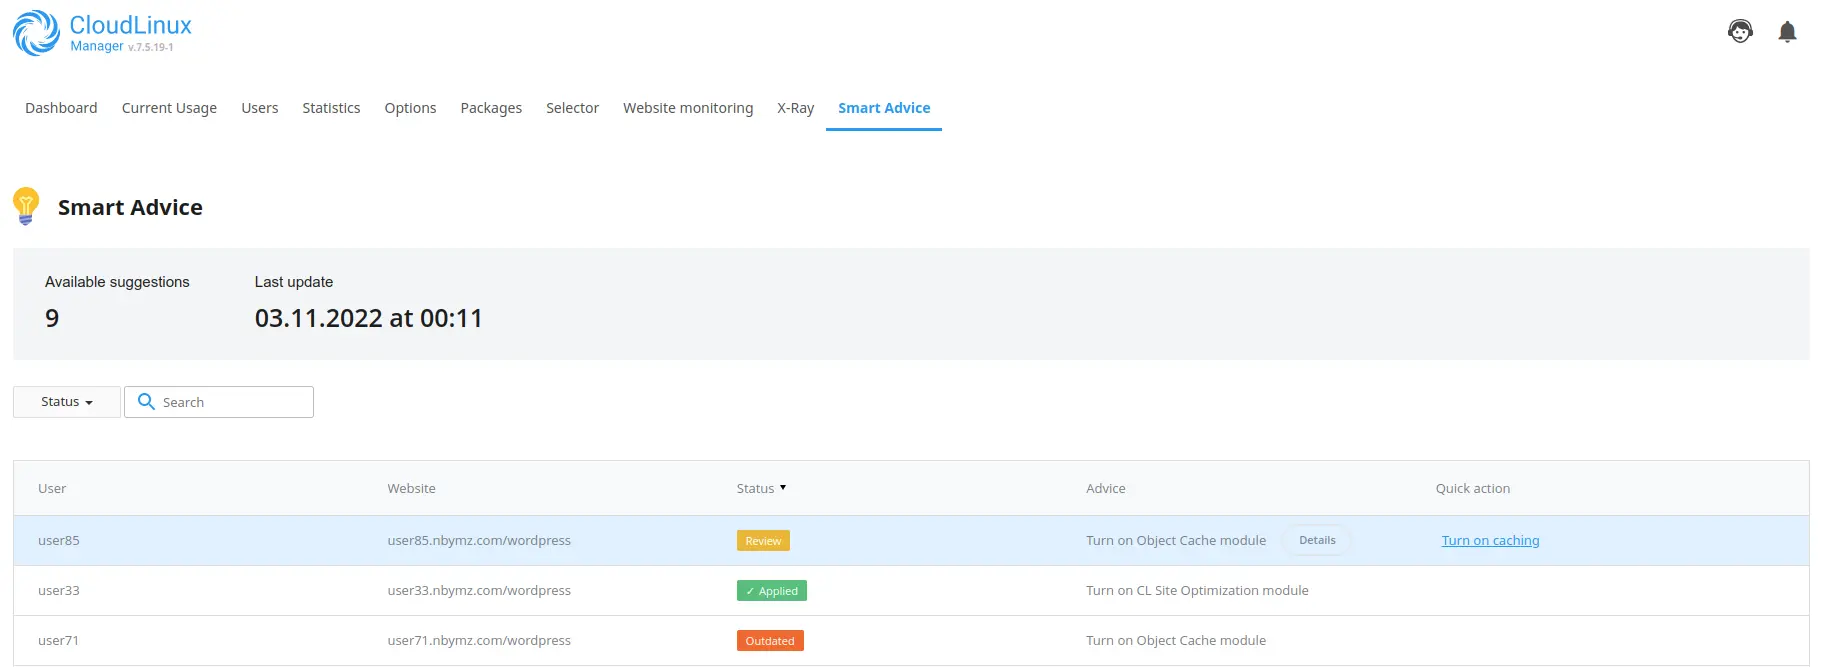
After the X-Ray finds advice you will see new advice in the Review status on the Smart Advice tab. Then you may use the Details button to see which URLs were found by X-Ray that will be speed up by that advice and use Quick Action to enable advice for a site.
Example of details:
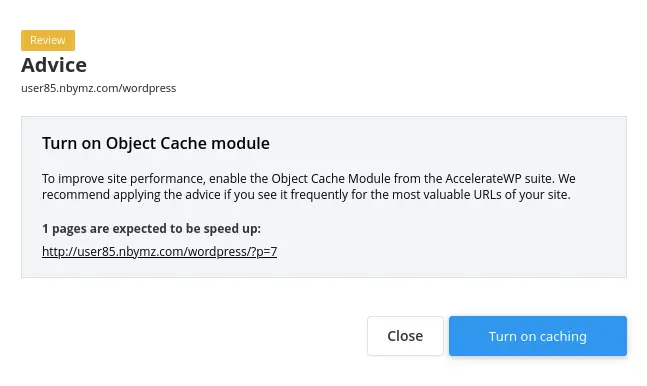
After you apply the advice by using Quick Action, the status will change to the Applied.
If a long time has passed since the last time the advice was updated for a site, it will be moved to the Outdated status.
Note
New X-Ray task may update Outdated advice if X-Ray finds performance issues that may be fixed by that advice. Then the status of advice becomes Review.
If the process of applying advice fails you will see an error log with a detailed error, you may try to fix it manually and try again or contact our support team for help.
Example when an error appears during advice applying:
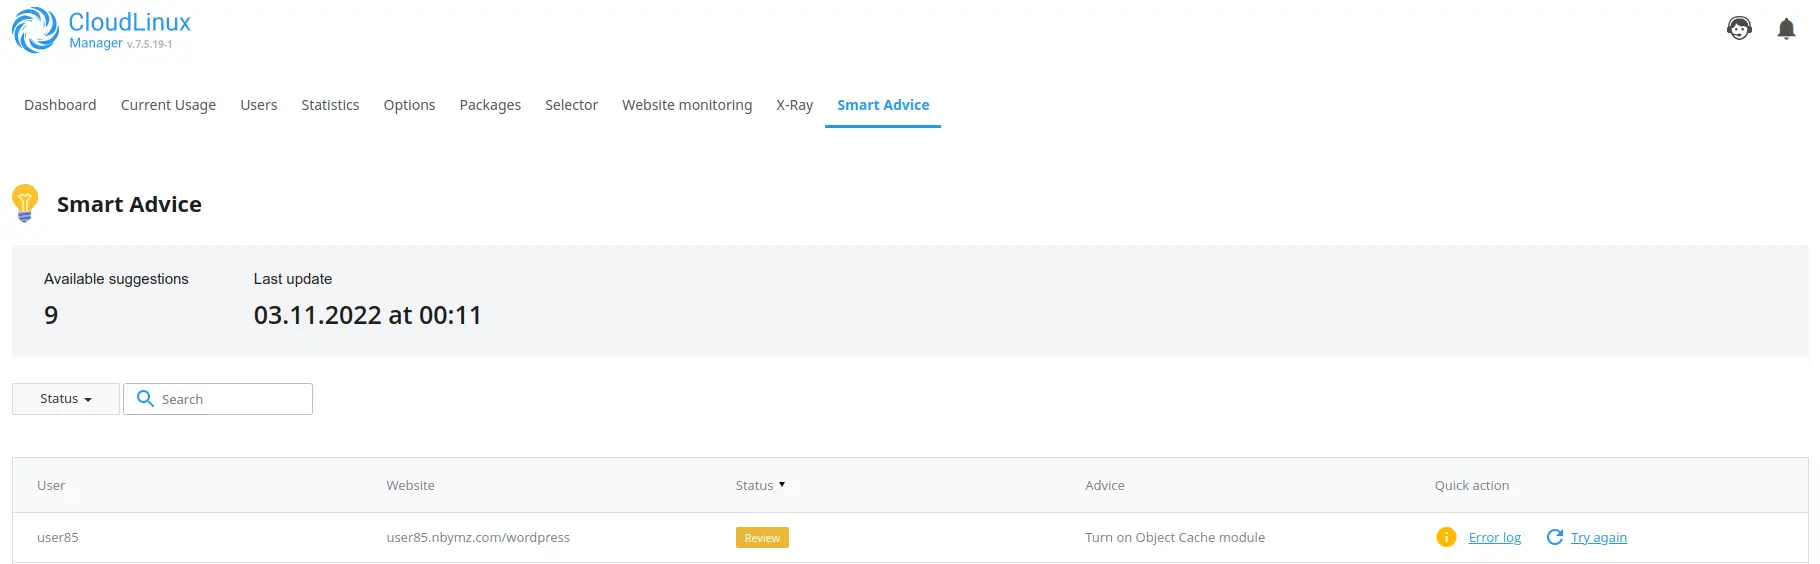
Smart Advice FAQ
Q: Why I can't see new advice on the Smart Advice tab?
A: For the generating of advice, it is necessary to run X-Ray tracing tasks, the best way to do it without manual interaction is to use X-Ray Autoracing. You can find more information on how to enable X-Ray Autotracing here.
Smart Advice CLI commands
CLI commands for managing feature advices
cl-smart-advice- for managing advices;
Starting from alt-php-xray-0.5-25 Smart Advice CLI utilities provide CLI versioning which is defined via --api-version option.
Note
It is highly recommended to specify CLI version explicitly via --api-version, otherwise CLI will rely on default settings, which cannot guarantee backward compatability.
cl-smart-advice --api-version <api_version> <command>
supported commands for --api-version=1:
list- shows list of all advices;apply- applies specific advice;rollback- rollbacks specific advice;
Advices list
--api-version=1
cl-smart-advice --api-version=<api_version> list
For each advice in the list the CLI command returns the following information:
metadata, which includes information aboutusername,domainandwebsitefor which the advice is issuedadviceinformation:- its identifier
id(id, that should be used in apply and rollback commands) - its
type(optimization feature identifier) - its
status- current status:revieworapplied module_name- name of optimization featureis_premium- if advice is for optimization feature from AccelerateWP Premium suitesubscription- info about optimization suite subscription (only if advice requires subscription)descriptionanddetailed_description- human-readable descriptions of advice- other internal informational fields
- its identifier
result- result of command: it may havesuccessor error details
Successful output example of cl-smart-advice --api-version=1 list:
{
  "data": [
    {
      "created_at": "2023-04-11T07:33:48.191870+00:00",
      "updated_at": "2023-04-11T07:33:48.191870+00:00",
      "metadata": {
        "username": "user16",
        "domain": "user16.com",
        "website": "/wordpress"
      },
      "advice": {
        "id": 23484,
        "type": "OBJECT_CACHE",
        "status": "review",
        "description": "Turn on Object Caching",
        "is_premium": true,
        "module_name": "object_cache",
        "subscription": {
          "status": "no",
          "upgrade_url": null
        },
        "total_stages": 0,
        "completed_stages": 0,
        "detailed_description": "To improve site performance, enable the Object Caching We recommend applying the advice if you see it frequen
tly for the most valuable URLs of your site."
      }
    },
    {
      "created_at": "2023-04-11T07:33:48.297784+00:00",
      "updated_at": "2023-04-11T08:51:42.362117+00:00",
      "metadata": {
        "username": "user16",
        "domain": "user16.com",
        "website": "/wordpress"
      },
      "advice": {
        "id": 23485,
        "type": "SITE_OPTIMIZATION",
        "status": "applied",
        "description": "Turn on AccelerateWP feature",
        "is_premium": false,
        "module_name": "accelerate_wp",
        "total_stages": 0,
        "completed_stages": 0,
        "detailed_description": "To improve site performance, enable the AccelerateWP optimization feature. We recommend applying the advice if you see it frequently for the most valuable URLs of your site."
      }
    }
  ],
  "result": "success",
  "timestamp": 1681203110
}
Failed output example of cl-smart-advice --api-version=1 list:
{"result": "Malformed API response"}
Apply advice
--api-version=1
cl-smart-advice --api-version=<api_version> apply --advice_id=<id_of_advice> [ --accept_license_terms ] [ --ignore-errors ]
--accept_license_terms - accept license terms on applying CDN type advice; --ignore-errors - ignore WordPress site web-checks after enabling optimization features;
advice_id from cl-smart-advice --api-version=<api_version> list output
Successful output example of cl-smart-advice --api-version=1 apply --advice_id=12345:
{
    "feature": {
        "enabled": true
    },
    "result": "success",
    "timestamp": 1690806590.0494235
}
feature: status of optimization to be applied via adviceenabled: true or false value meaning feature is enabled or not
result: result of command: it may havesuccessor error details
Failed output example of cl-smart-advice --api-version=1 apply --advice_id=12345:
{"result": "Malformed API response"}
Rollback advice
--api-version=1
cl-smart-advice --api-version=<api_version> rollback --advice_id=<id_of_advice>
advice_id from cl-smart-advice --api-version=<api_version> list output
Successful output example of cl-smart-advice --api-version=1 rollback --advice_id=12345:
{
    "feature": {
        "enabled": false,
        "visible": true
    },
    "result": "success",
    "timestamp": 1690806844.9735684
}
feature: status of optimization to be applied via adviceenabled: true or false value meaning feature is enabled or notvisible: true or false value meaning feature is visible or not
result: result of command: it may havesuccessor error details
Failed output example of cl-smart-advice --api-version=1 rollback --advice_id=12345:
{"result": "Malformed API response"}
Advanced performance analytics
By enabling this feature, X-Ray will add JavaScript profiling code to each WordPress site during the tracing process. This will allow X-Ray to provide highly detailed insights into each website’s performance (greatly enhancing the quality and accuracy of SmartAdvice). The performance metrics that will be collected include TTFB (Time To First Byte), Total Blocking Time, First Contentful Paint, and more. The profiling code does not collect any user or visitor data nor sensitive data of any kind. The sole purpose of this profiling code is to gather performance-related metrics to better optimize the website.
How to enable/disable via UI
You can manage the setting in several interfaces:
X-Ray settings:
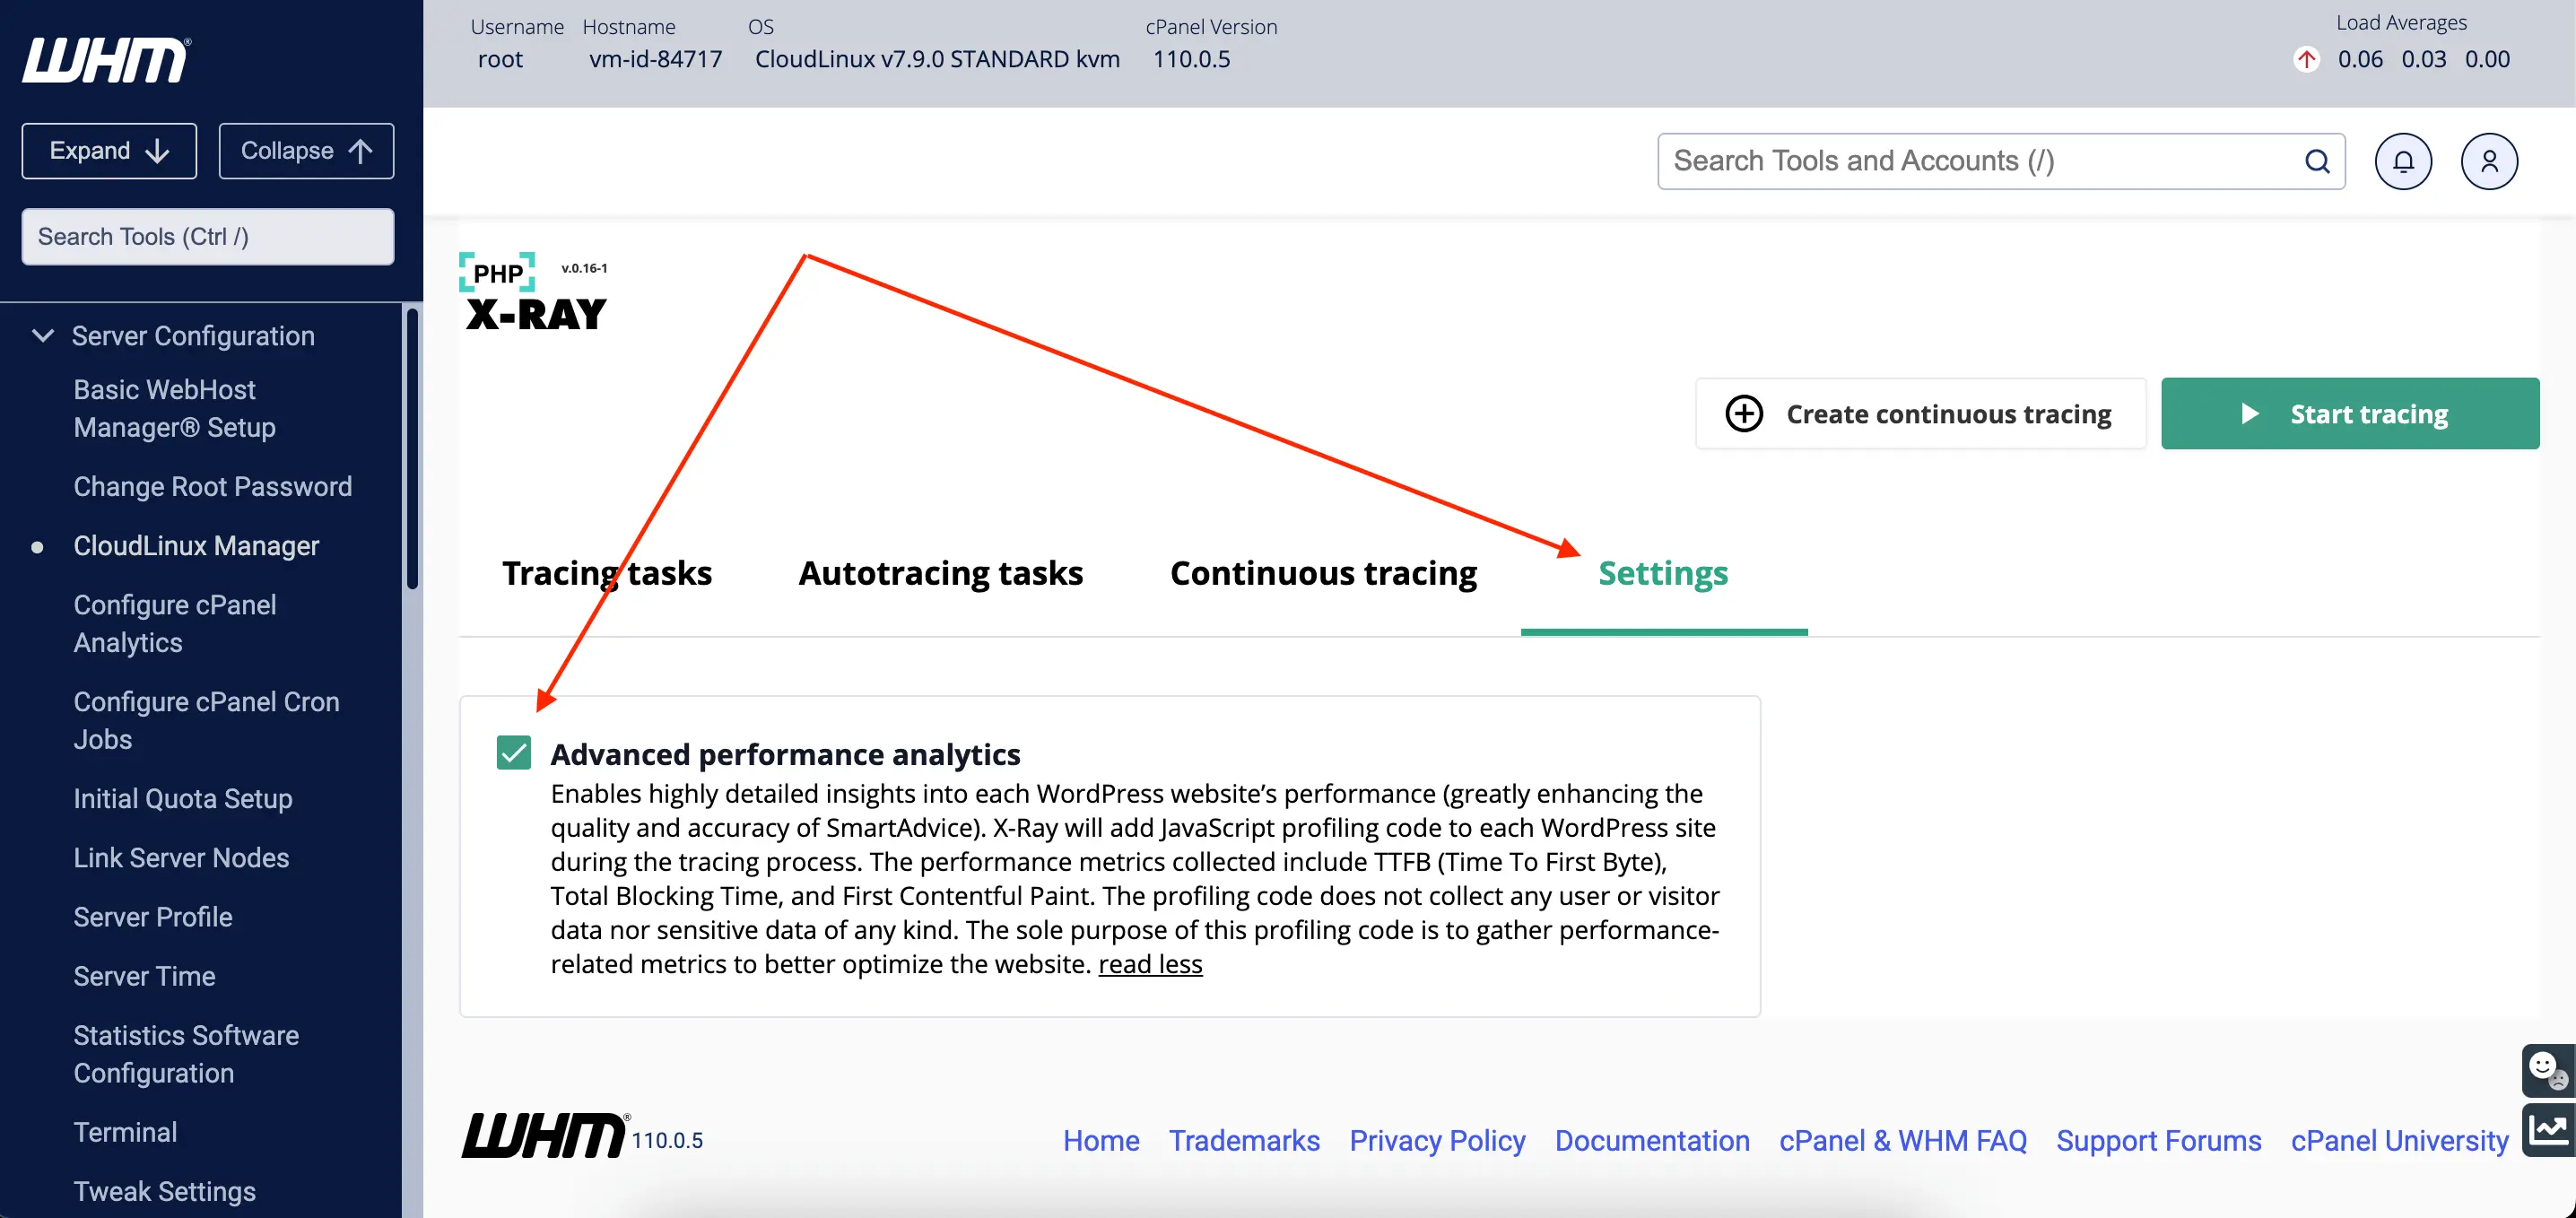
AccelerateWP settings:
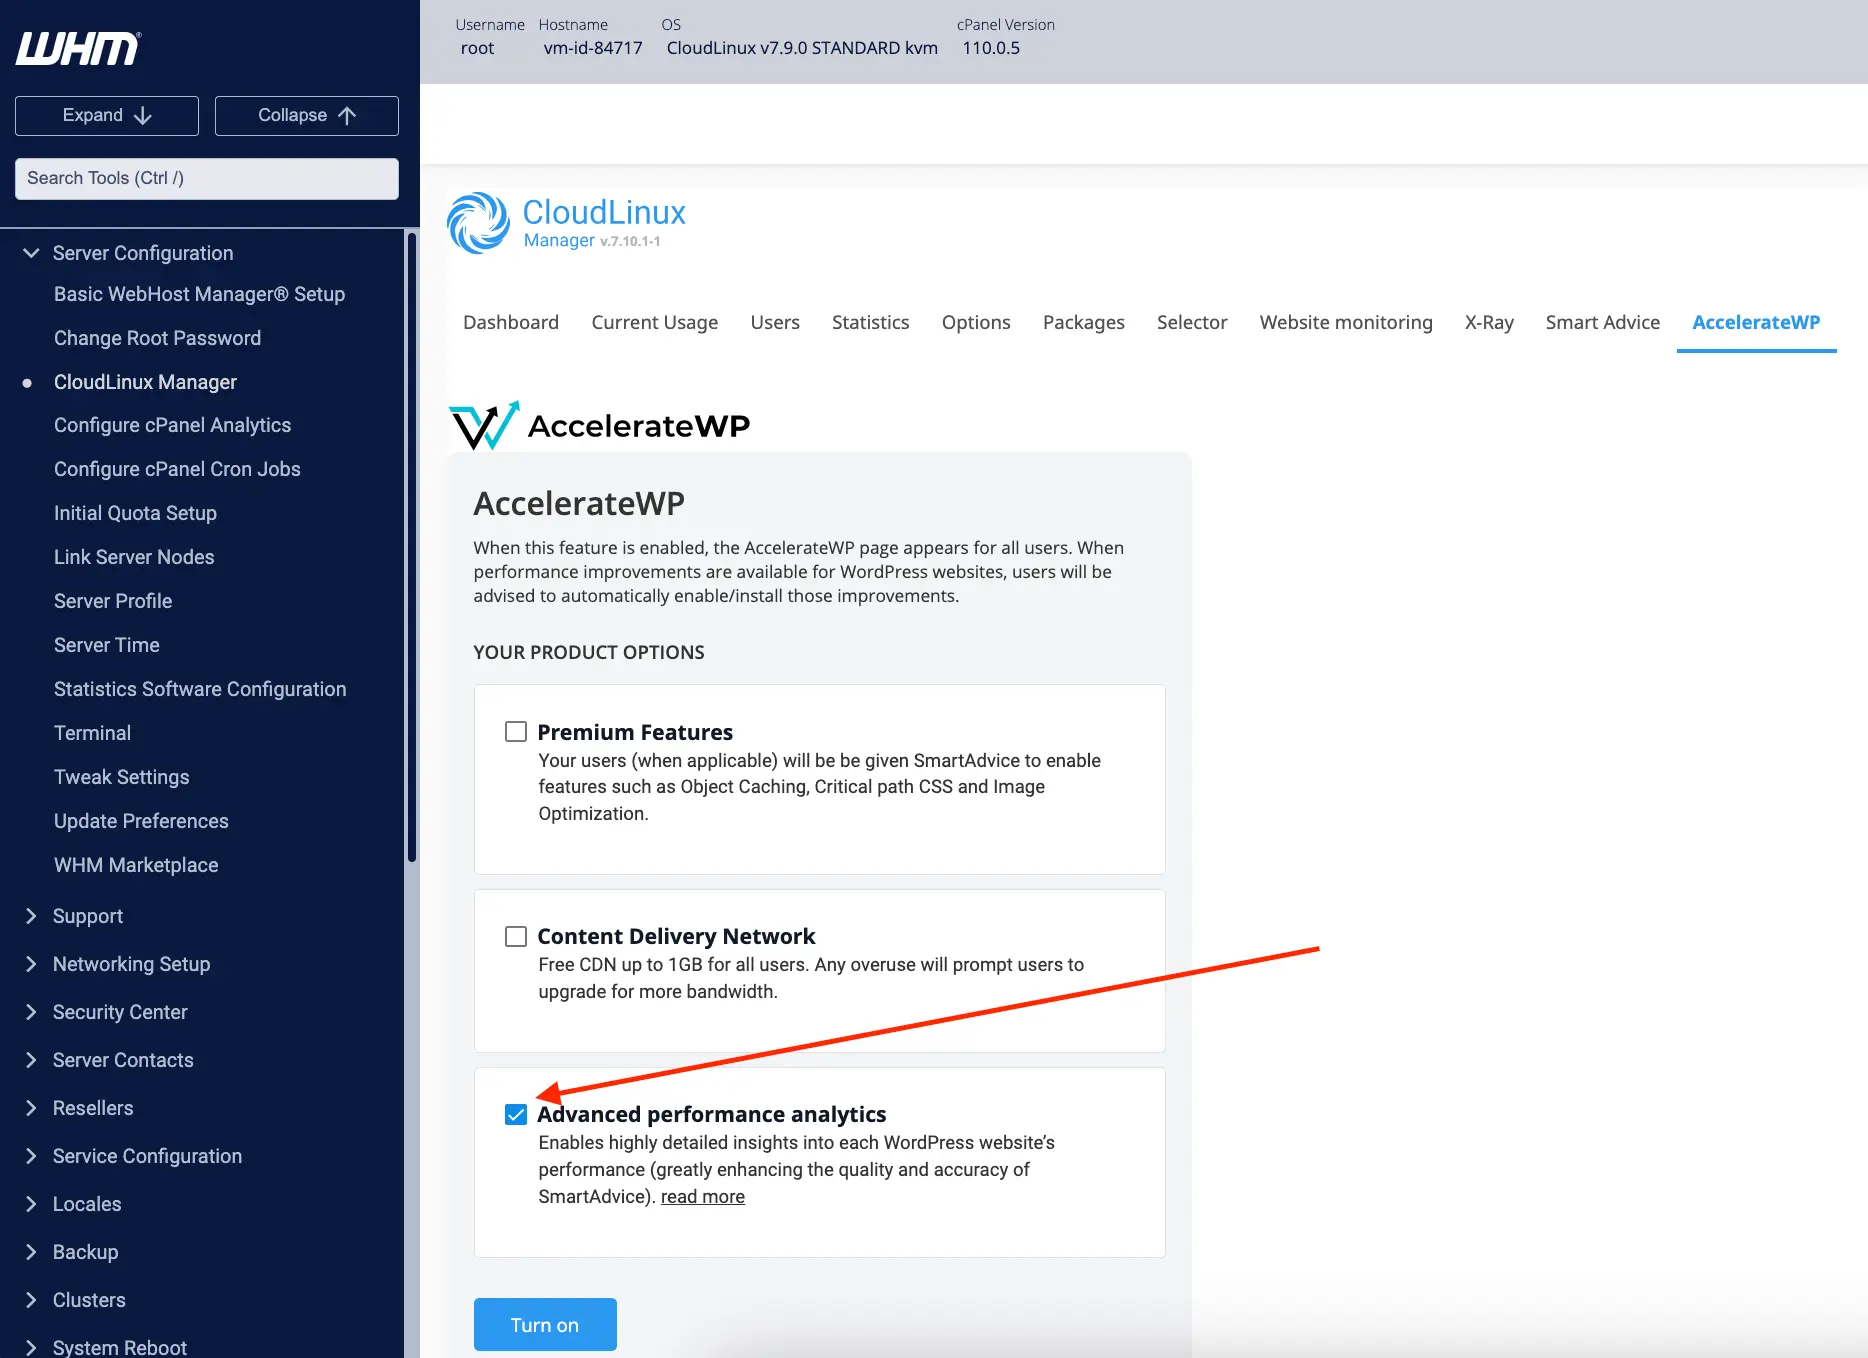
How to enable/disable via CLI
cloudlinux-xray-manager advanced-metrics --enable
cloudlinux-xray-manager advanced-metrics --disable
How it works
To start advanced performance monitoring, you can enable tracing tasks that involve adding a JavaScript snippet to the bottom of your WordPress page. This snippet facilitates performance monitoring and allows X-Ray to gather valuable insights.
Once tracing tasks are enabled, the JavaScript snippet will periodically send POST requests to our secure analytics service.
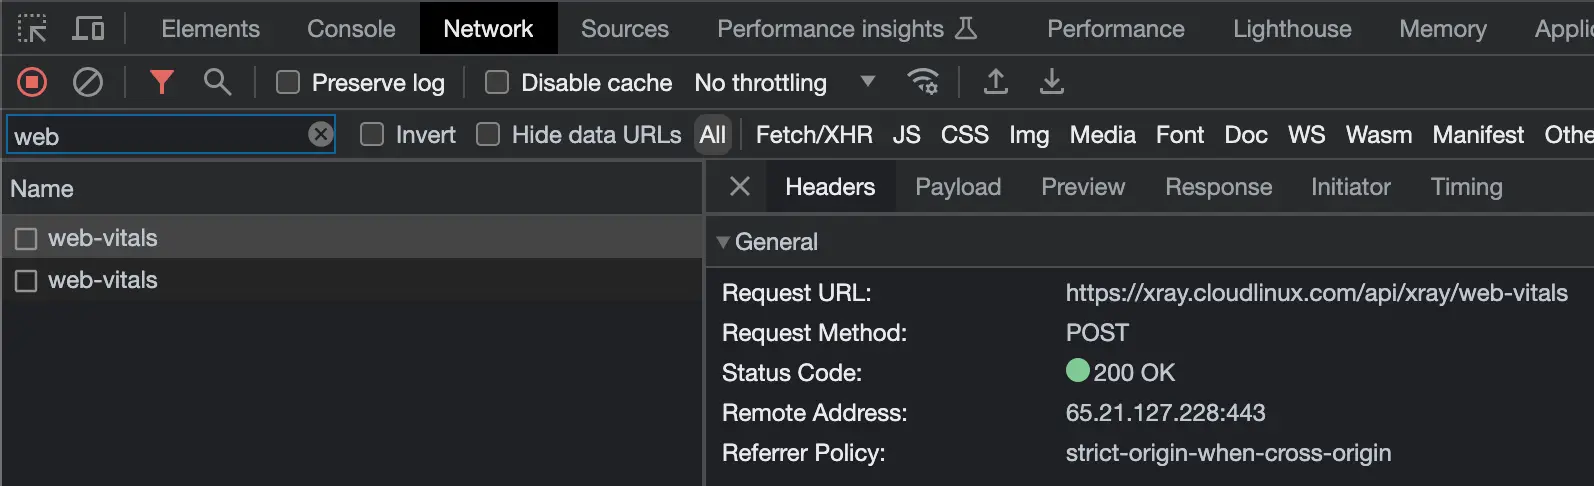
These requests capture anonymous data about page load time and resources.
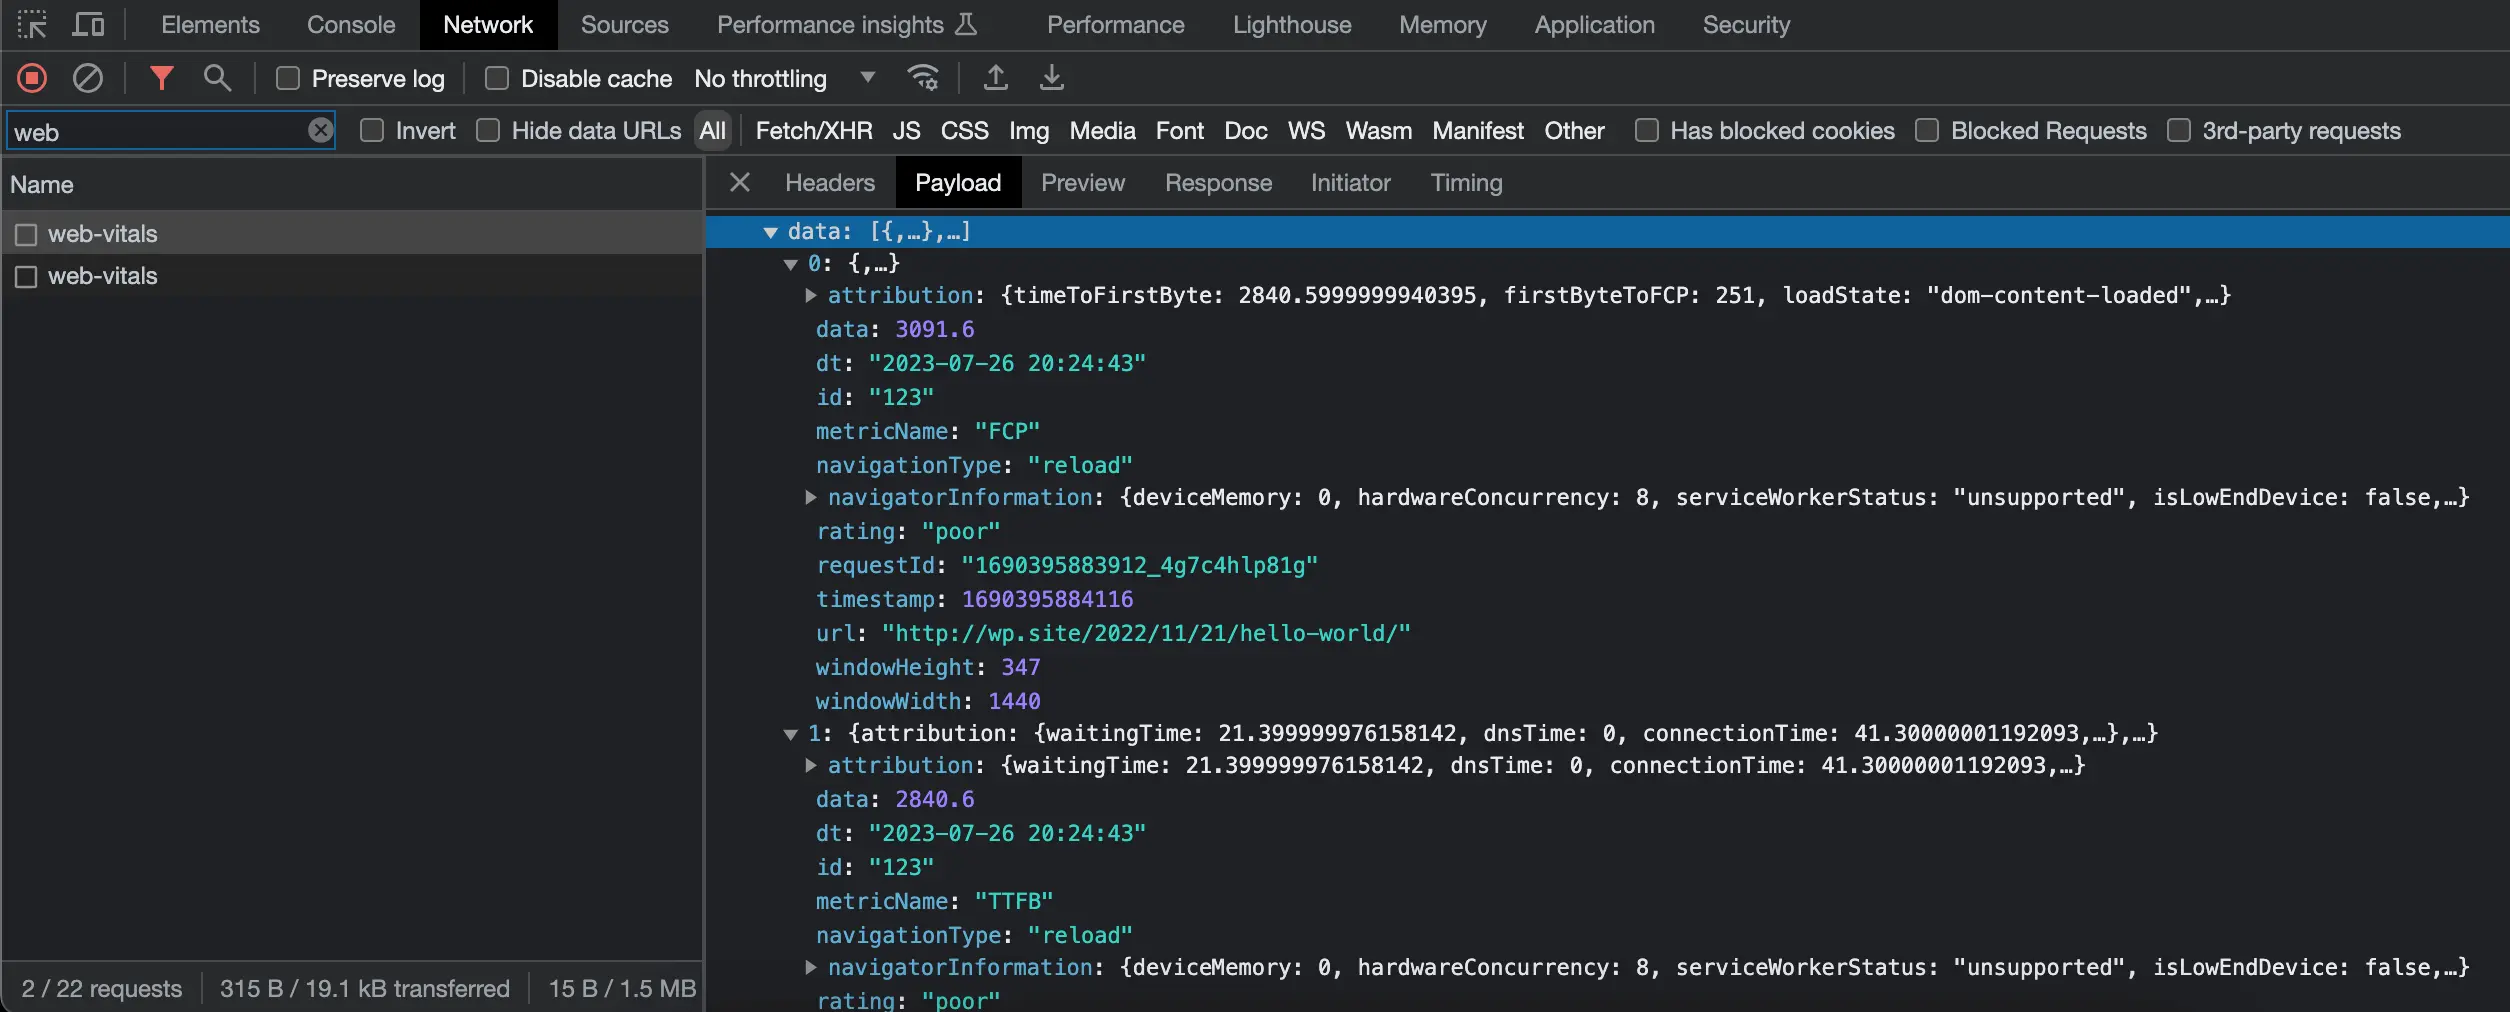
End-user X-Ray plugin
Warning
To use the end-user X-Ray plugin, update your LVE Manager and X-Ray packages to the lvemanager-6.3.9-1 (or later) and alt-php-xray-0.3-1 (or later) by running the following command:
yum update lvemanager alt-php-xray
How to enable/disable the end-user X-Ray plugin
You can hide or show the end-user X-Ray plugin icon by ticking or unticking the proper checkbox in the LVE Manager.
Go to LVE Manager → Options Tab → User interface settings.
Note
The X-Ray plugin icon in the end-user interface is hidden when the checkbox is ticked.
How to manage the end-user X-Ray plugin
The web interface of the end-user X-Ray plugin is almost the same as the X-Ray administrator interface.
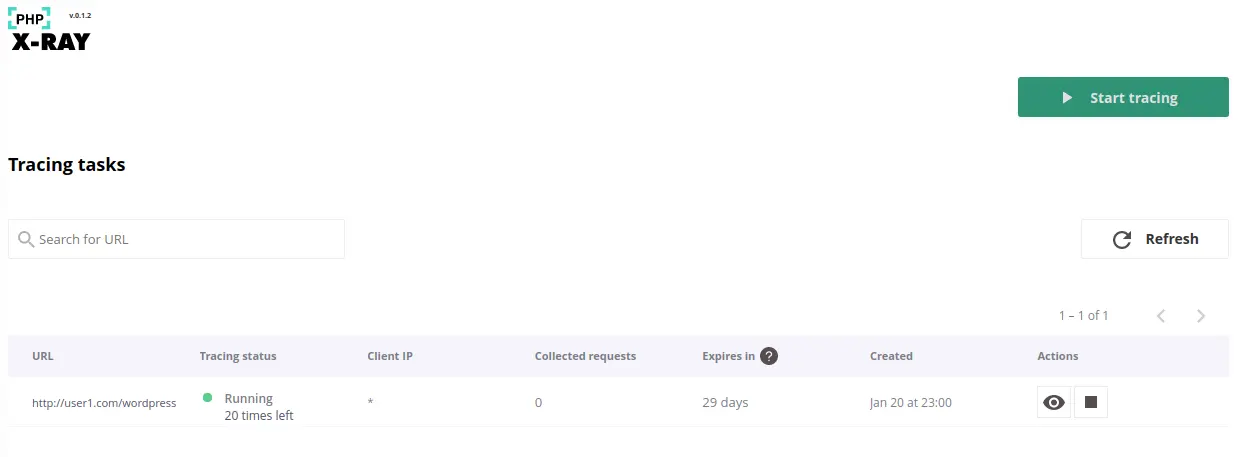
But there are some differences and they are described further.
- End-users can create tasks only for their domains from the drop-down list:
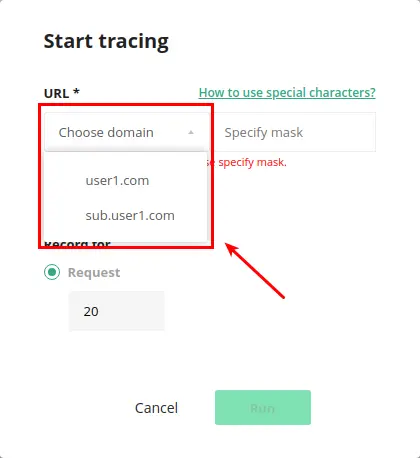
- To specify URL or wildcard, end-users should use the input field next to the domain:
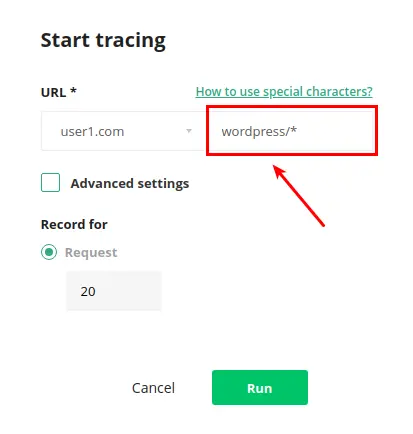
You can read about all other basic interface elements and managing tracing tasks in the Managing tracing task section.
Note
Tracing tasks created by an end-user will also be displayed in the administrator interface and administrators can manage the end-user's tasks the same way as they manage their own. At the same time, tasks created by the administrator or other end-users will not be displayed in the UI of the current user.
End-user X-Ray plugin limitations
The end-user X-Ray plugin does not support creating continuous tasks.
The end-user has a limit of tracing tasks running at a time. Before starting the next task, the end-user should wait for the completion of the previous ones or forcefully stop the running ones. Otherwise, the user will get the next error:

Note
The current limit is one tracing task per user.
The administrator and the end-user can’t run the tracing task for the same Domain/URL at the same time. Once, the administrator started a specific tracing task, the end-user will not be able to duplicate it. And the same is true for the administrators – they will just see the running task for the specific domain and see the notification that they're trying to create a tracing task with a duplicated URL.
If continuous tracing is enabled for the domain, the end-user will not be able to create a new task for this domain because the same rule works - it will be a duplicate of the existing tracing tasks. The next warning will appear:
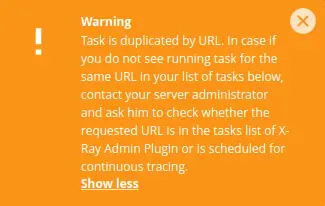
To solve this, the existing running tasks for the same Domain/URL should be stopped or completed. You can find more details about this in the FAQ.
If a user's tracing task was created for a domain which is using the FPM handler there's an additional limitation. To avoid frequent reloads of the particular FPM service, Start tracing , Stop tracing or Continue tracing action would be blocked in case if the latest reload of a corresponding FPM service was done less than 1 minute ago.
If a user gets such an error message - it means that 1 reload in 1 minute for a particular FPM service has been already done. Just try performing the same operation once again in a while.
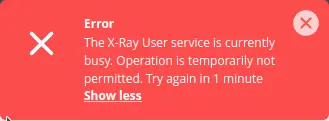
X-Ray automated throttling detection
Note
CPU throttling detection is available since alt-php-xray-0.3-2 and lvemanager-xray-0.5-2.
IO/IOPS throttling detection is available since alt-php-xray-0.3-7 and lvemanager-xray-0.7-1.
kmod-lve-2.0-23(and later) for CloudLinux OS 8 or CloudLinux OS 7 hybridkernel-1.5-58(and later) for CloudLinux OS 7 or CloudLinux OS 6 hybrid
are also required to utilize the feature of IO/IOPS throttling detection.
Warning
X-Ray automated throttling detection feature is not supported for CloudLinux OS 6
The X-Ray automated throttling detection system checks if the account exceeds LVE limits by CPU or by IO/IOPS during the HTTP request execution. Requests with exceeded LVE limits are indicated in both X-Ray Administrator and X-Ray User plugins.
If CPU limiting was detected for a particular request, it is indicated in the X-Ray UI that the system itself has slowed down the request processing due to CPU throttling and this is apparently not a performance issue in the PHP code.
If limiting by IO and IOPS in total was detected for a particular request, it is indicated in the X-Ray UI in the same manner, except for the cause of slowing down the request -- IO throttling.
The case of both limiting for the request is also possible.
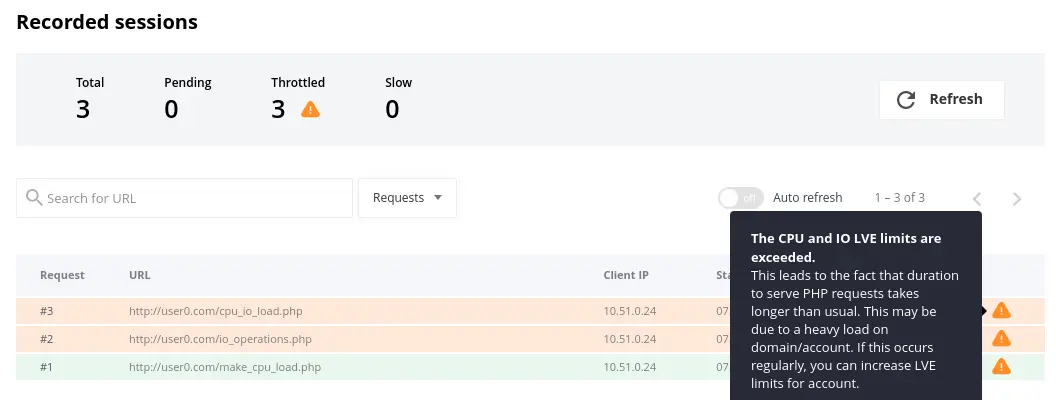
Requests with exceeded LVE limits are also marked in the request detailed view.
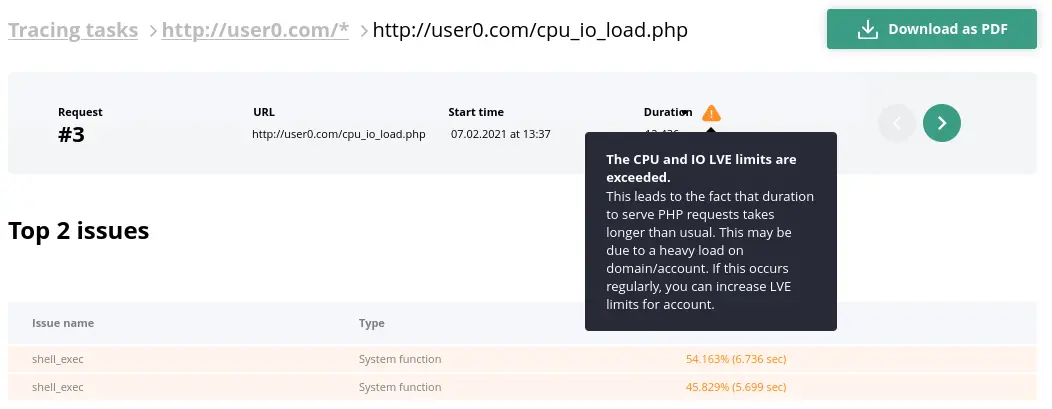
Requests with exceeded LVE limits are marked in the PDF report as well.
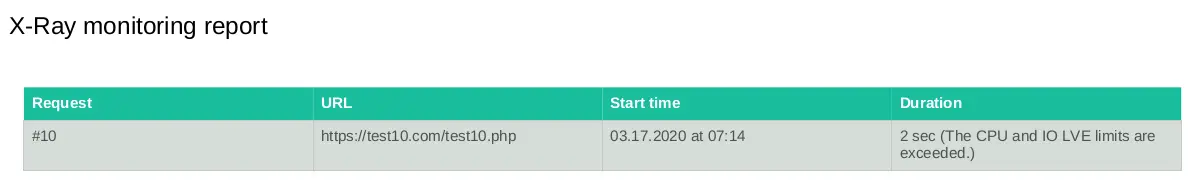
X-Ray client
X-Ray client is a PHP extension named xray.so. It analyzes the processing time of the entire request and its parts and then sends the data to the X-Ray agent.
List of supported PHP versions
The list of currently supported PHP versions:
| ALT PHP: | EA PHP: | Plesk PHP | DirectAdmin PHP | Other panels PHP |
|
|
|
|
|
Warning!
php-zts and custom PHPs, rolled in selector, are not supported
Functions that X-Ray client can hook
Database queries
- Functions from the MySQL extension:
mysql_querymysql_db_querymysql_unbuffered_query
- Functions from the MySQLi extension:
mysqli_querymysqli::querymysqli_multi_querymysqli::multi_querymysqli_real_querymysqli::real_query
- Functions from the PDO extension:
PDO::execPDO::queryPDOStatement::execute
External requests
- Function curl_exec
System PHP functions
It may be any PHP system function which can be related to a PHP engine or other PHP extension, for example fopen() or json_encode(). A list of these functions can be found here.
Configuration Options
xray.enabled
Syntax: xray.enabled=On/Off
Default: On
Changeable: PHP_INI_SYSTEM
Description: Enable or disable X-Ray extension from php.ini
xray.database_queries
Syntax: xray.database_queries=[number]
Default: 20
Changeable: PHP_INI_SYSTEM
Description: The number of the slowest SQL queries which will be sent to the X-Ray agent. The min value is 0 and the max value is 100. If the variable value is more, the default value will be used.
xray.external_requests
Syntax: xray.external_requests=[number]
Default: 20
Changeable: PHP_INI_SYSTEM
Description: The number of the slowest external requests (the curl_exec function) which will be sent to the X-Ray agent. The min value is 0 and the max value is 100. If the variable value is more, the default value will be used.
xray.system_functions
Syntax: xray.system_functions=[number]
Default: 20
Changeable: PHP_INI_SYSTEM
Description: The number of the slowest system functions which will be sent to the X-Ray agent. The min value is 0 and the max value is 100. If the variable value is more, the default value will be used.
xray.backtrace_depth
Syntax: xray.backtrace_depth=[number]
Default: 10
Changeable: PHP_INI_SYSTEM
Description: The backtrace depth to the main() function which will be sent to the X-Ray agent. The min value is 0 and the max value is 20. If the variable value is more, the default value will be used.
xray.processor
Syntax: xray.processor=[processor_name]
Default: xray
Changeable: PHP_INI_SYSTEM
Description: Tells the X-Ray client which processor to use. The new processors may be added in the future. The default processor is xray which means to send data to the X-Ray agent.
xray.tasks
Syntax: xray.tasks=host:uri:ip:id
Default: no value
Changeable: PHP_INI_SYSTEM
Description: The current tracing tasks for the given PHP request. This directive is added automatically by the X-Ray manager when creating a task. It is not allowed to edit manually, as X-Ray may stop working.
xray.to_file
Syntax: xray.to_file=On/Off
Default: Off
Changeable: PHP_INI_SYSTEM
Description: Only for debug purposes. Writes to a file data which is sent to the processor.
xray.debug
Syntax: xray.debug=On/Off
Default: Off
Changeable: PHP_INI_SYSTEM
Description: Only for debug purposes. Enables debug output during request processing. In the On mode can slow down the domain.
xray.debug_file
Syntax: xray.debug_file=[path_to_file]
Default: /tmp/xray-debug.log
Changeable: PHP_INI_SYSTEM
Description: Only for debug purposes. Specifies a file for logging debug information.
X-Ray agent
This is a service that receives data from the X-Ray client and sends it to the remote storage.
Managing X-Ray service
The X-Ray agent is managed by the service utility.
To start the X-Ray agent, run the following command:
service xray-agent startTo stop the X-Ray agent, run the following command:
service xray-agent stopTo restart the X-Ray agent, run the following command:
service xray-agent restart
FAQ
Does X-Ray affect website performance?
X-Ray affects website performance. Our tests show 5-10 % overhead from a website loading time with X-Ray tracing enabled. X-Ray allows you to find website performance issues and should not be enabled permanently. If your website is very slow, you can enable X-Ray to find the cause and then disable it.
My customers override php versions in different folders and X-Ray does not trace those websites, what should I do?
You should turn on the X-Ray serverwide mode or the X-Ray phpinfo mode.
What should I do if I see the warning "Task is duplicated by URL"?
This warning means that you already have a task to trace this URL in the list of your tracing tasks. If you see this warning, a new task can be created only with the On hold status and you will be able to run it only when the previous task with the same URL will be completed.
Note that the URL field supports wildcard matching and you can have a case when X-Ray is tracing the URL=domain.com/* and you are trying to create a new task with URL=domain.com/xray.php. In this case, you will see that warning because the * URLs array includes xray.php.
I started a tracing task and made requests to URL but did not see any results in the UI. What should I do?
X-Ray may not send data if a site uses a caching plugin, as the caching plugin is outputting HTML, thus there are no PHP scripts to examine. We encountered such issues with sites that use LSCache and WP Super Cache plugins. Check that your site does not use caching plugins. If so, disable it while tracing a site to get information from X-Ray. Moreover, it can also be because of caching on server side, for example NGINX Cache. Or when using CDN because requests are processed from another host. In such cases, during tracing, caching must also be disabled.
If you set a client’s IP when creating the tracing task, check that your requests come to the server with this IP via phpinfo (since there may be NAT between your local machine and the server).
![phpinfo row: $_SERVER['REMOTE_ADDR'] value 10.106.1.145](/images/cloudlinuxos/shared-pro/x-ray/XRayPHPInfoRemoteAddr.webp)
Check that xray extension is enabled for the domain. To do so, go to the
phpinfo()page and make a request. In the phpinfo output try to find the following section: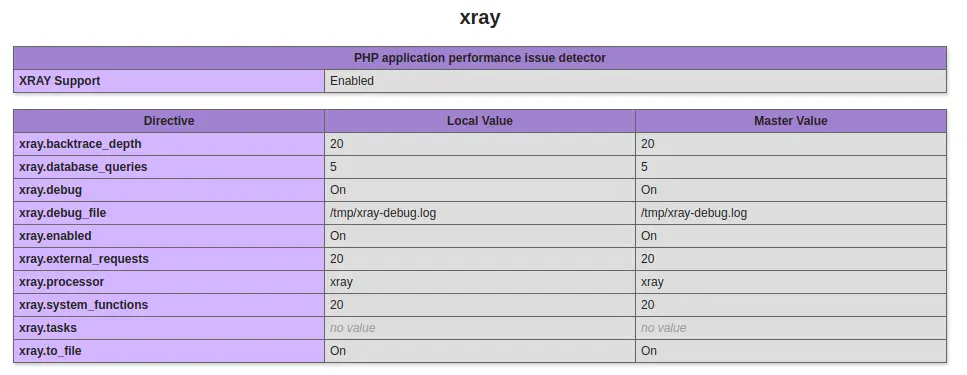
If you cannot see that section, try to restart PHP processes for that user (the simplest way is to restart Apache) and check that you can see the xray extension.
If you can see the xray extension in the phpinfo, check that X-Ray agent service is running with the service xray-agent status command. If it is not running, start it with the
service xray-agent startcommand.If, after checking the previous items, the issue persists, contact our support team.
What to do if X-Ray is not found in the phpinfo() page?
If you managed to create a tracing task, this means that the xray.ini file was created in a system. Therefore, there may be two reasons why it did not appear in the phpinfo page of the domain.
PHP process wasn't reloaded after adding the xray.ini. To solve this, you should restart the Apache or fpm service for the domain on which the tracing was started. At the moment, this is done automatically by the X-Ray manager after creating the task.
Your domain uses a PHP version different from the one which was detected by the X-Ray manager. To solve this, check the scan dir for additional ini files for your domain.

Then check the
ini_locationthat was passed to the X-Ray manager by running the following command:cat /usr/share/alt-php-xray/manager.log | grep ini_locationFind your tracing task in the output and check that the
xray.iniexists in this directory, also check that theinipath is the same in the phpinfo page output and in theini_locationdirective for your tracing task. If they are the same, you should reload your PHP. If they are different that means that the X-Ray manager could not correctly determine the PHP version your domain uses. In this case, contact our support team at https://cloudlinux.zendesk.com/hc/requests/new.
I use LiteSpeed, X-Ray is enabled and it is shown in the phpinfo() page but does not collect data when sending requests to a site. What to do?
Check for the CacheLookup on option in the htaccess file for your domain. If the option is there, LiteSpeed processes requests bypassing the PHP X-Ray extension. In this case, to get tracing information, you should remove the CacheLookup on option.
What is the proper format for the URL?
All of the examples below are correct:
http://domain.comhttp://domain.com/https://domain.comhttps://domain.com/
You can use any of them with a prefix www. and it is also correct.
What packages are required for X-Ray?
Required packages:
lvemanager>= 6.2.10-1alt-php-xray>= 0.2-1
Link server to CLN account (available only for resellers and activated by demand)
Why do we need a server linking to CLN?
One of the main CloudlinuxOS Shared Pro features is Centralized Monitoring. In case when a customer uses the license provided by the reseller the server registered with such license will be linked to the reseller's CLN account. As a result, customers cannot see the data in Centralized Monitoring. To allow a customer to see the data in such a case we implemented an ability to link the server to the customer's own CLN account.
Who can use it?
Only customers who use CloudlinuxOS Shared Pro licenses provided by resellers can use this feature. However, it's crucial to understand when linking is appropriate.
The primary users for this feature are customers of license-only resellers. If you acquired your license this way, you can link the server to your CLN account. By doing so, you acknowledge that it is your responsibility to only link servers that belong to the same owner.
Сonditions under which linking is not advisable!
Some partners use a single account to manage servers they own directly alongside servers they resell to various clients. To avoid mixing data and granting unintended access, these distinct groups of servers should not be linked to one end-customer account.
Info
If you are a reseller and interested in this feature, please leave your request on our feature portal.
How to link a server? If your server is linkable you will see in the Cloudlinux Manager UI (Dashboard tab) the component with input field which allows linking the server to CLN.
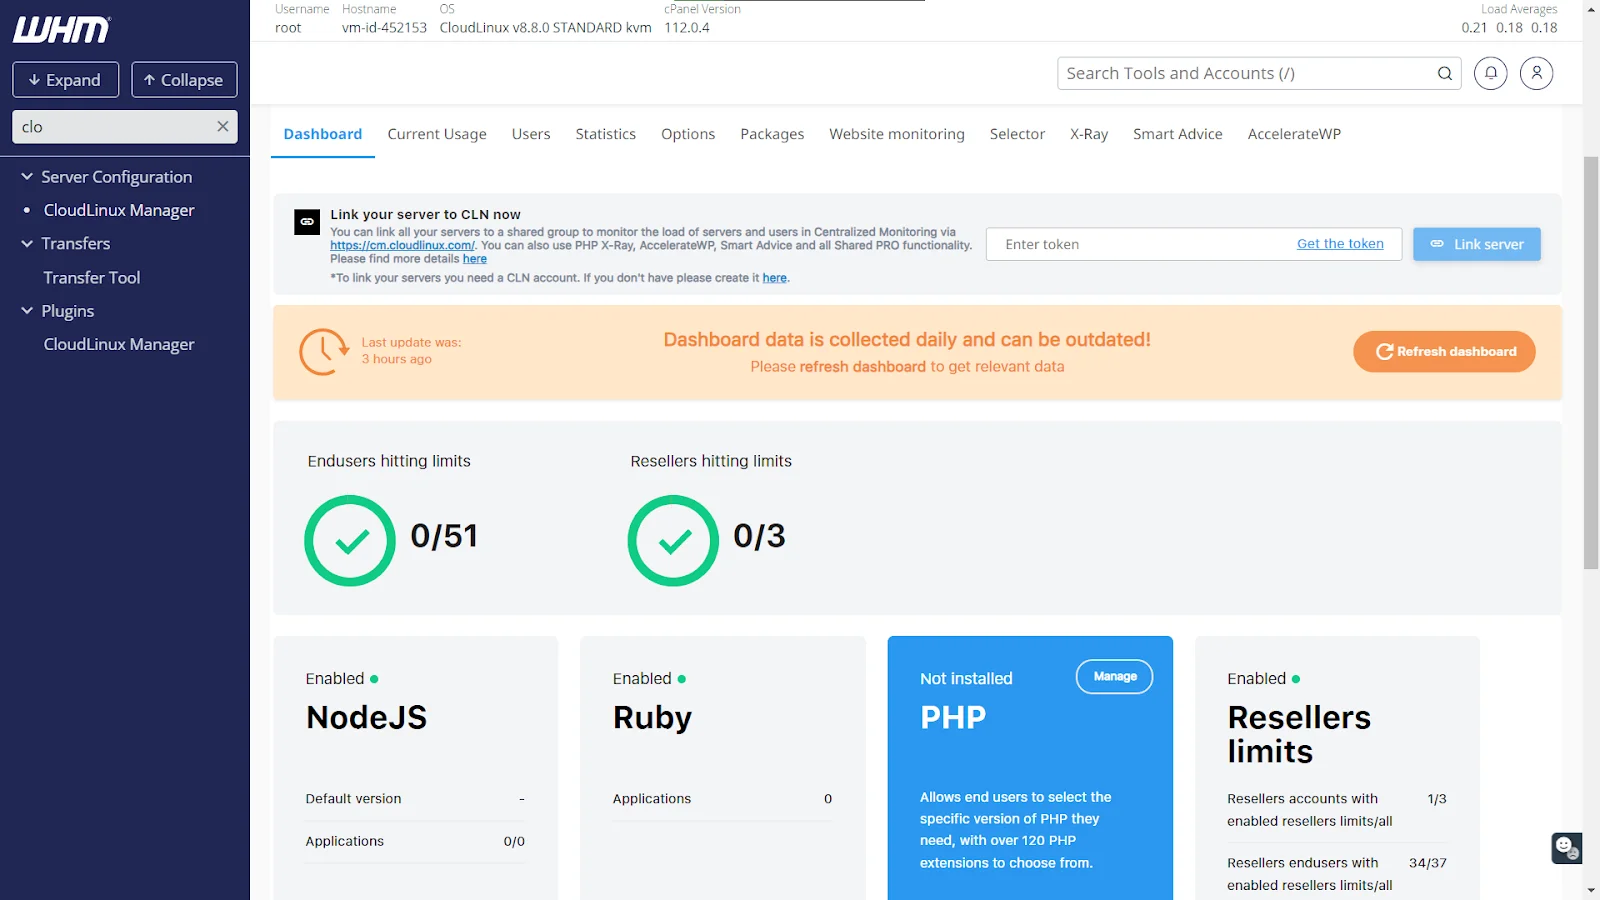
To link the server, it is required to perform the following:
- Create a CLN account if you do not have one https://cln.cloudlinux.com/console/register/customer.
- Log into your CLN account and copy the linking token. If you click the “Get the token” button you will be redirected to https://cln.cloudlinux.com/console/profile/details where can copy the token
- Paste the token into the “Enter token” input and click the “Link server” button
After these steps you server will be linked. And you will see it in the Centralized Monitoring.
CLI utility /usr/sbin/cl-link-to-cln
We can also bind a server from the command line. To do this can be used /usr/sbin/cl-link-to-cln utility.
/usr/sbin/cl-link-to-cln --help
Usage: cl-link-to-cln [options]
Options:
  -h, --help            show this help message and exit
  -t TOKEN, --linking-token=TOKEN
                        Token to link the server
  -s, --linking-status  Show if status linked or not
To link we have to:
- Check if the server can be linked:
/usr/sbin/cl-link-to-cln --linking-status
{
    "result": "success",
    "timestamp": 1698670480.3382068,
    "linked": false,
    "linkable": true
}
- linked (boolean) field define if server is already linked
- linkable (boolean) field define if server can be linked
- Link the server with the command:
/usr/sbin/cl-link-to-cln --linking-token=TOKEN
Token you can find here https://cln.cloudlinux.com/console/profile/details.