CloudLinux Manager
CloudLinux Manager is a plugin for most popular control panels including cPanel, Plesk, DirectAdmin and ISPmanager (InterWorx coming soon). It allows you to control and monitor all CloudLinux OS Solo features.
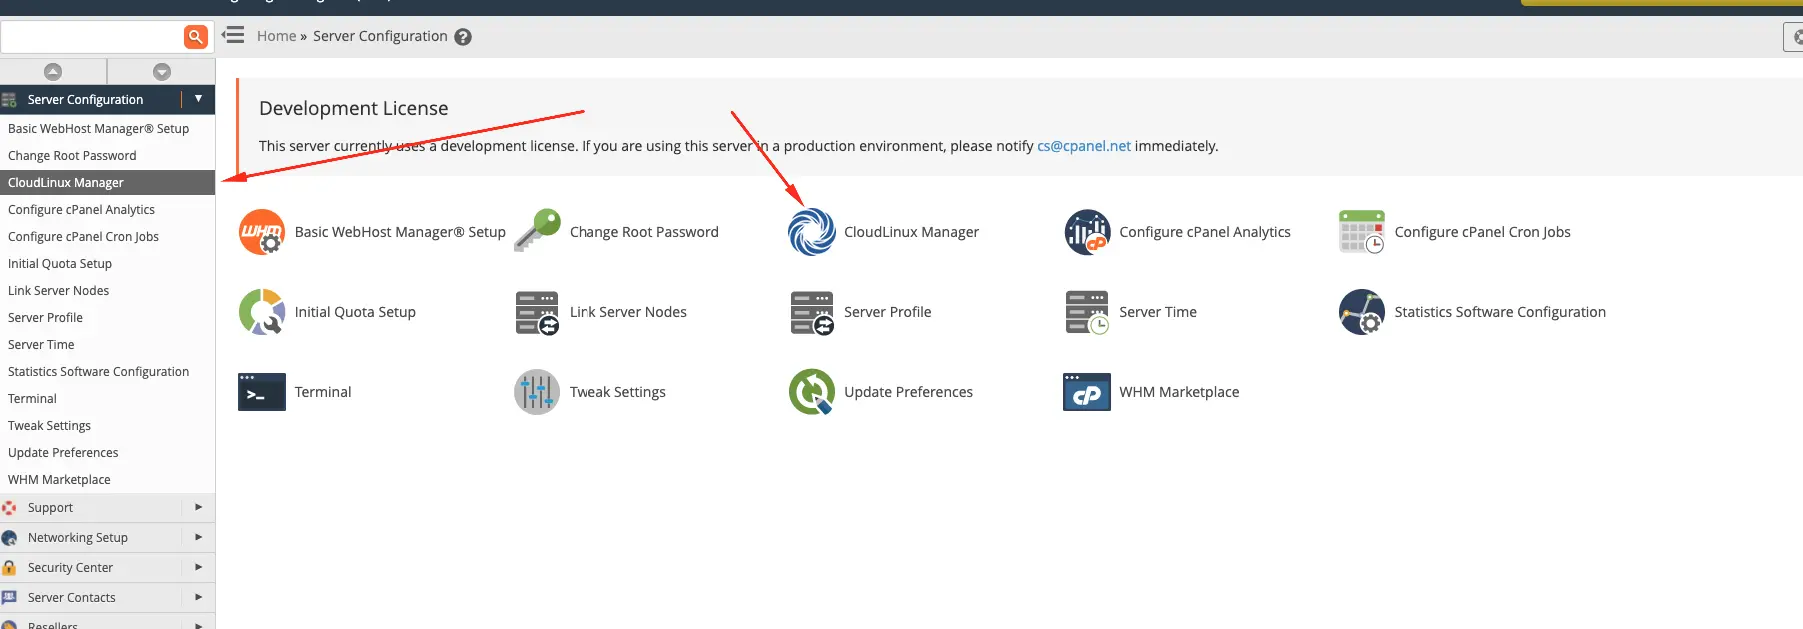
CloudLinux Manager (previously LVE Manager) is accessible via the Server Configuration tab:
Warning
LVE Manager is renamed to CloudLinux Manager since cPanel v 96.0.9
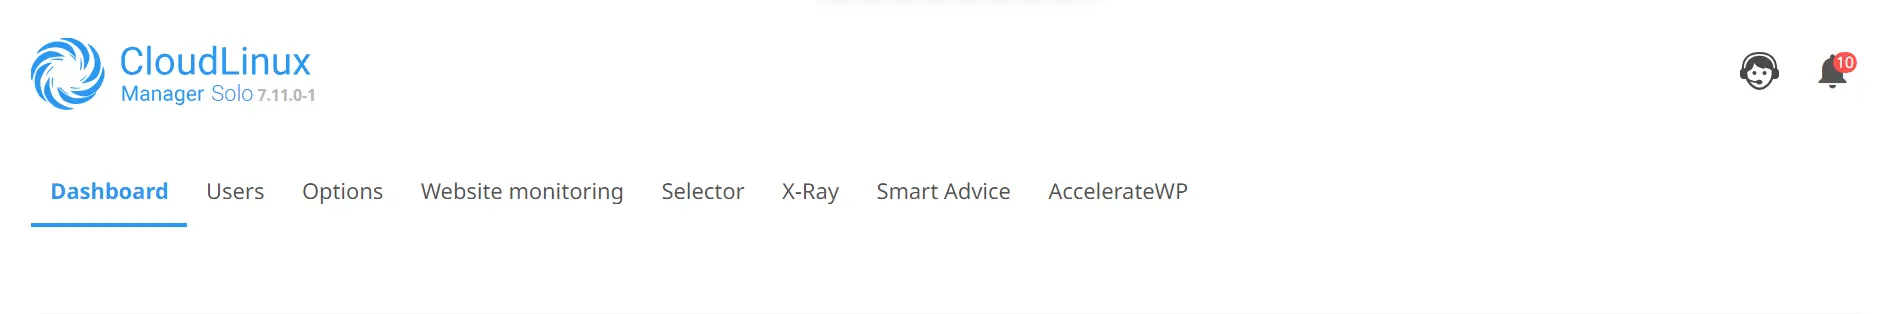
Log in as administrator to get access to the following functionality:
- Dashboard - provides a quick overview of statistics and all administrative information for server administrators;
- Users tab - provides access to manage user limits;
- Options tab - provides access to user interface settings, CageFS and Python/NodeJs selectors;
- Website Monitoring provides access to Website Monitoring and PHP Slow Site Analyzer;
- X-Ray tab - provides access to X-Ray;
- Selector tab - provides access to PHP Selector;
- Smart Advice tab - provides ability to see advice list generated for your WordPress websites;
- AccelerateWP tab - provides access to AccelerateWP;
Activation
To start using CloudLinux Manager, it must be activated with your CloudLinux OS Solo activation key.
In order to activate CloudLinux Manager features, follow the next steps:
Enter your CLN activation key if you already have it
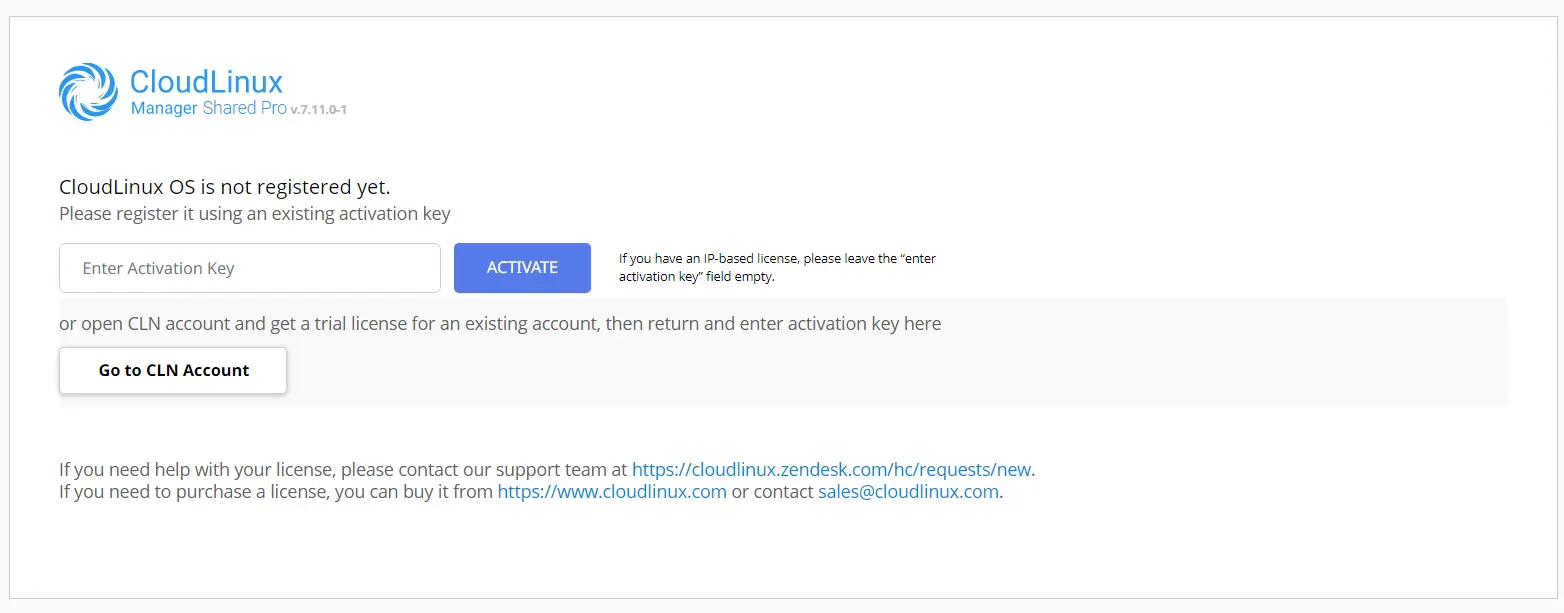
If you have IP-based license, please leave the Enter Activation Key field empty and just click Activate.
You can read more about CloudLinux OS Solo and how to get the license here
Website Monitoring tool
Website Monitoring tool (WMT) is a tool that collects the statistics of the domains' availability and responsiveness, as well as errors that occur when accessing these domains. An admin can get email reports with the statistics. The Website Monitoring tool uses the simple curl request like curl http://domain.com to get domains’ statistics.
You can configure the Website Monitoring tool and the Slow Site analyzer and view the daily reports in the CloudLinux Manager -> Website monitoring tab.
There are Main, PHP Site analyzer, and Settings subtabs here.
Warning
For now, there is no any possibility to remove the alt-php-ssa and cl-web-monitoring-tool packages so that the Website monitoring tab will be removed. You can turn off the Website monitoring, PHP Sites Analyzer in the Settings tabs, so sites statistics will stop collecting and there will be no additional load on the server.
Main
This subtab views the latest report (for the last 24 hours) of the Website monitoring tool.
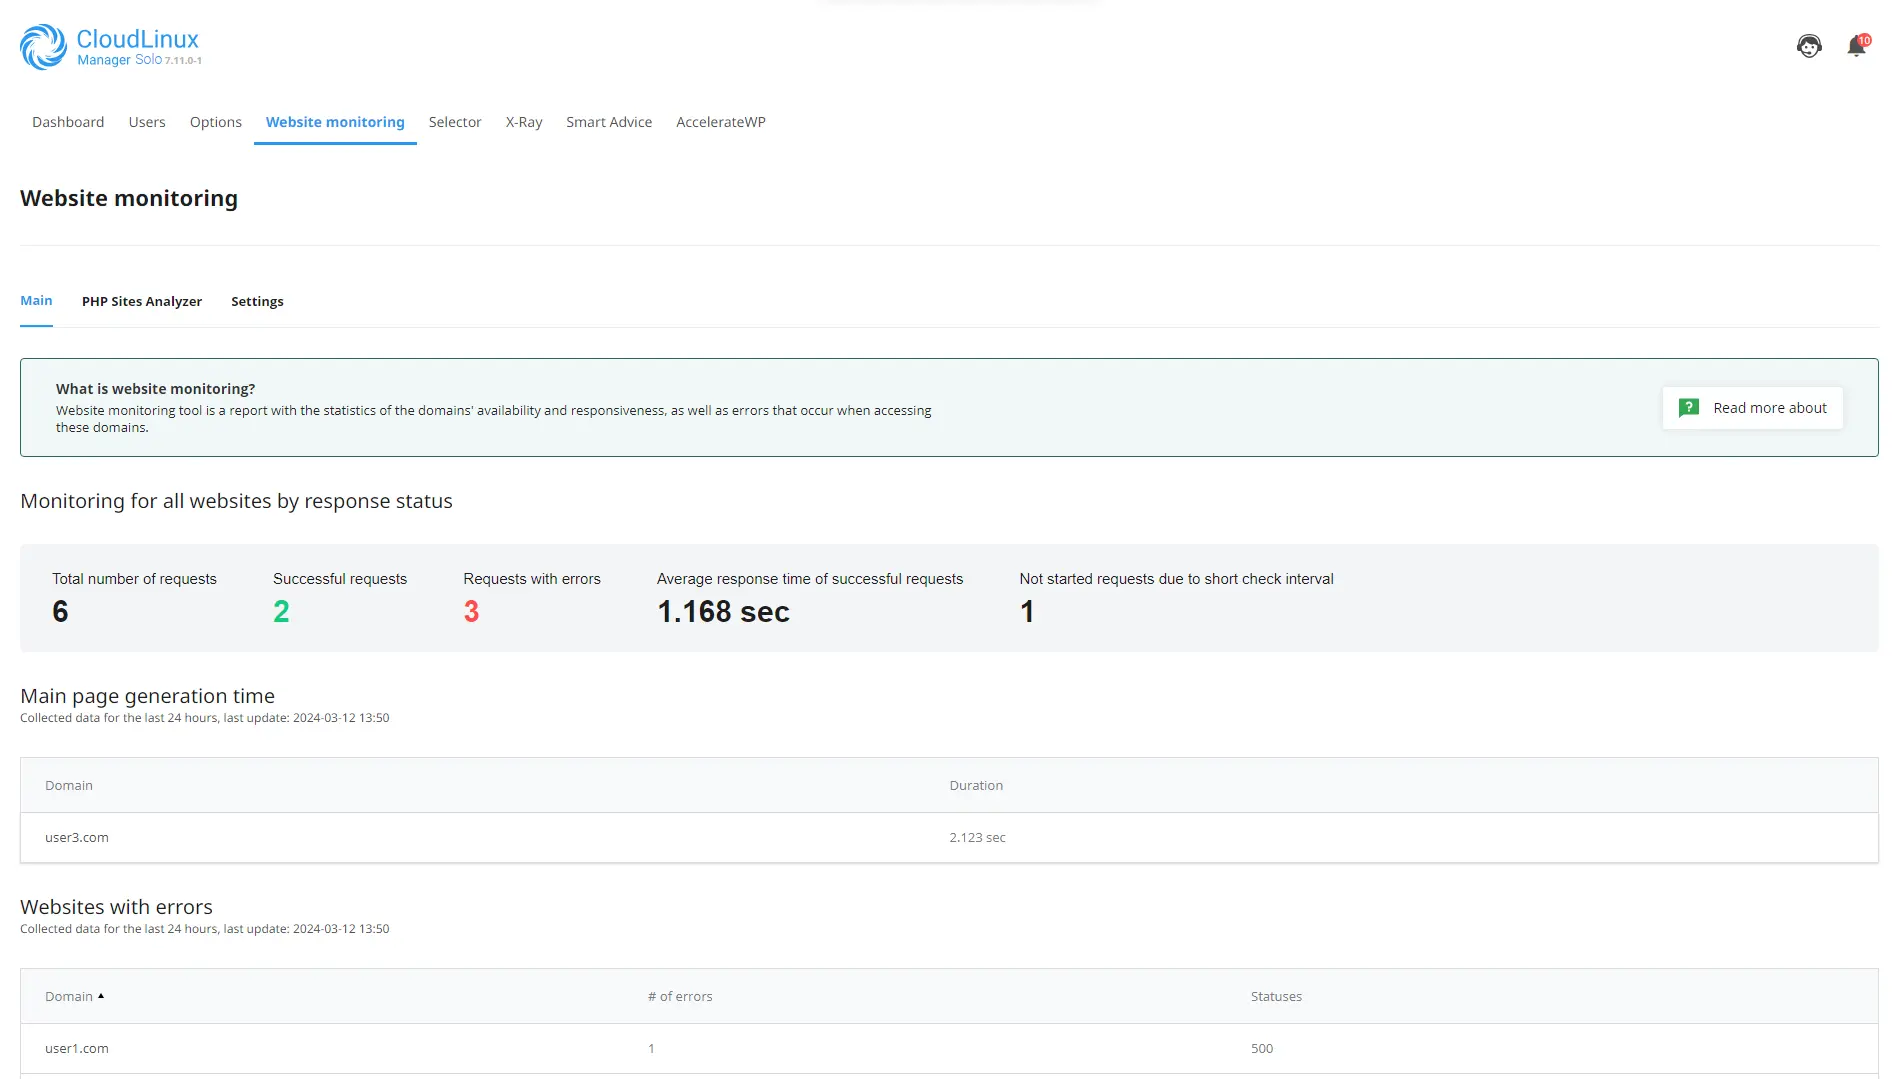
Report is regenerated each time the page is loaded, so all changes in configuration (the Settings tab) or in the list of domains will be applied immediately.
- Total number of requests - requests that were sent to all domains, existing on the servers
- Successful requests - the number of requests for all domains with status code 200
- Requests with errors - the number of requests for all domains which status code is not 200
- Not started requests due to short check interval - this metric is used to adjust configuration. If it is not equal 0, an admin should increase the value of Requests sending interval, because the tool does not fit into this interval to send requests to all domains.
- Slowest websites in 24h and Websites with most errors in 24h - in these sections you can find the number of domains that was exposed here.
WMT Settings
To enable or disable Website Monitoring, use the following slider.

- Email to send report - all email notifications will be sent to this email address
Warning
If email is not specified, all notifications will be sent to control panel administrator's email.
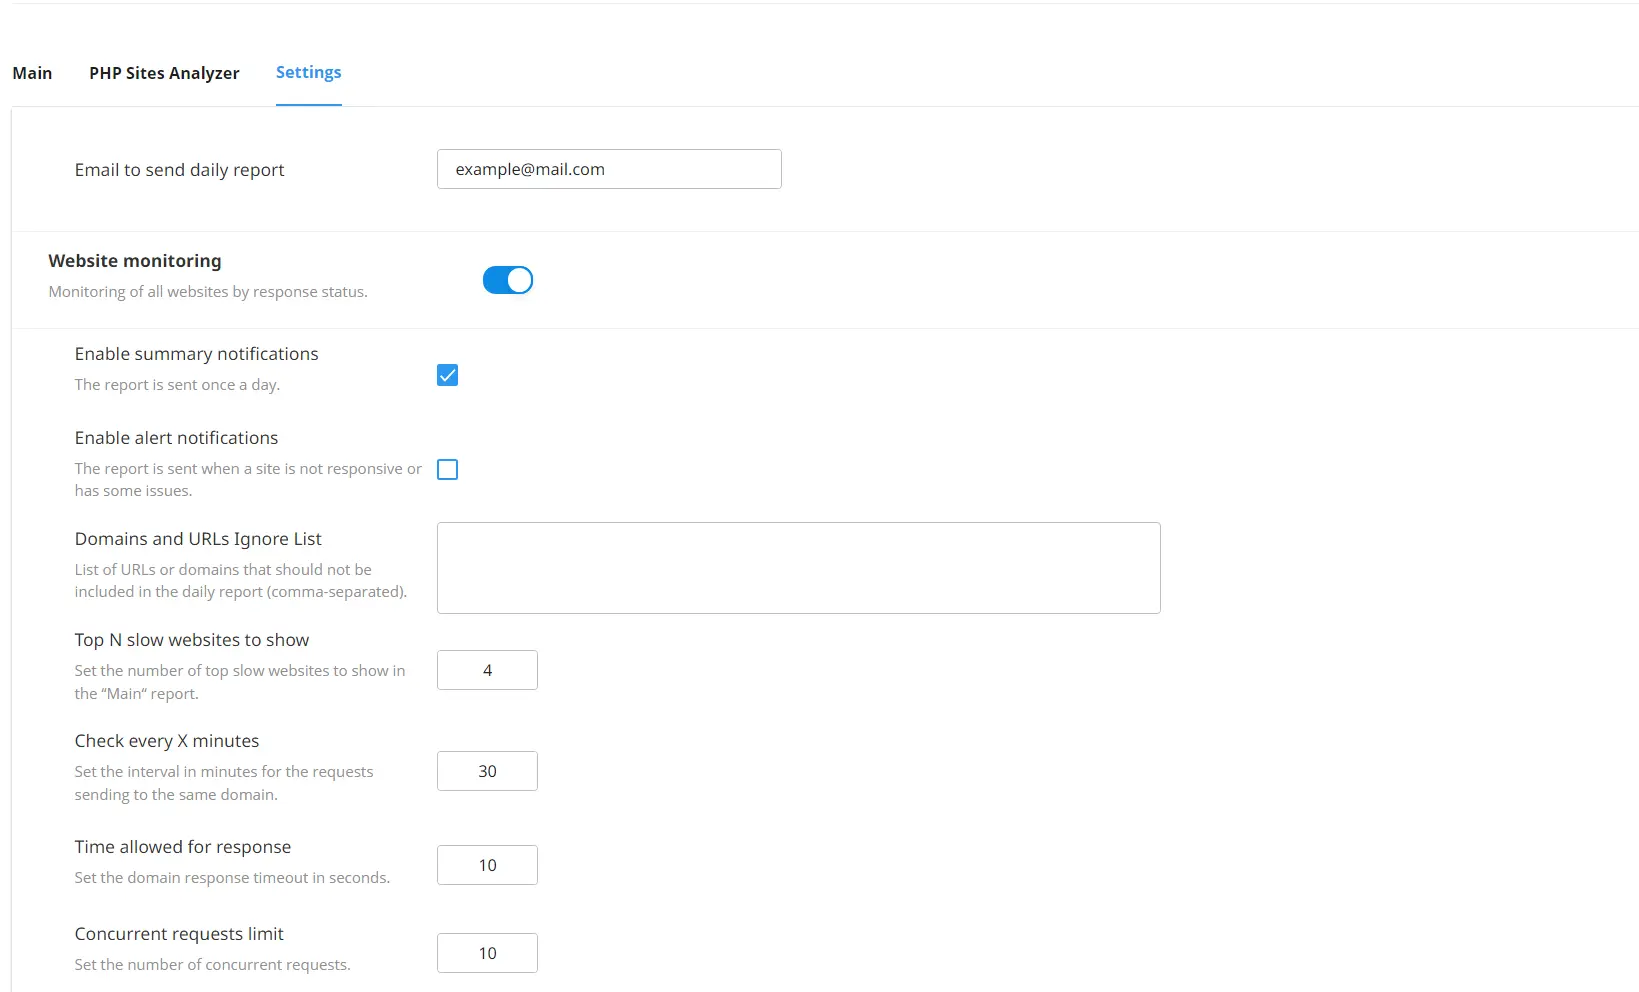
- Enable summary notifications - turn on/off summary daily email report notifications
- Enable alert notifications - turn on/off immediate alert email notifications
- Domains and URLs Ignore List - domains and URLs that will not be requested and displayed in reports; supported formats:
example.com, http://example.com - Top N slow websites to show - this number (N) will be used to select the top N domains from the list of all domains, sorted by response duration (Slowest websites list). And this number also will be used to select the top N domains from the list of all domains, sorted by amount of errors (Websites with most errors list).
- Check every X minutes - this is a period in minutes between requests to the same domain.
- Time allowed for response - if there is no answer from the website for this period of time, the Website Monitoring tool will regard this behaviour as the
HTTP 408error. - Concurrent requests limit - how many concurrent requests can be done by the Website Monitoring tool.
WMT CLI
The wmt-api utility allows managing Website Monitoring tool via CLI.
Usage
# /usr/share/web-monitoring-tool/wmtbin/wmt-api [command] [--optional arguments]
Optional arguments:
-h, --help | show help message and exit |
Commands:
config-change | set the WMT configuration using the JSON string that follows the command |
config-get | get the WMT configuration as JSON |
report-get | generate a report for last 24 hours |
send-clickhouse | send the summary report to the ClickHouse |
start | start the WMT system |
status | check the status of the WMT system |
stop | stop the WMT system |
Example of the /usr/share/web-monitoring-tool/wmtbin/wmt-api command usage:
/usr/share/web-monitoring-tool/wmtbin/wmt-api --config-change "{\"ping_timeout\":10,\"ping_interval\":5,\"report_email\":\"user@example.com\"}"
This way you can set all or only certain parameters.
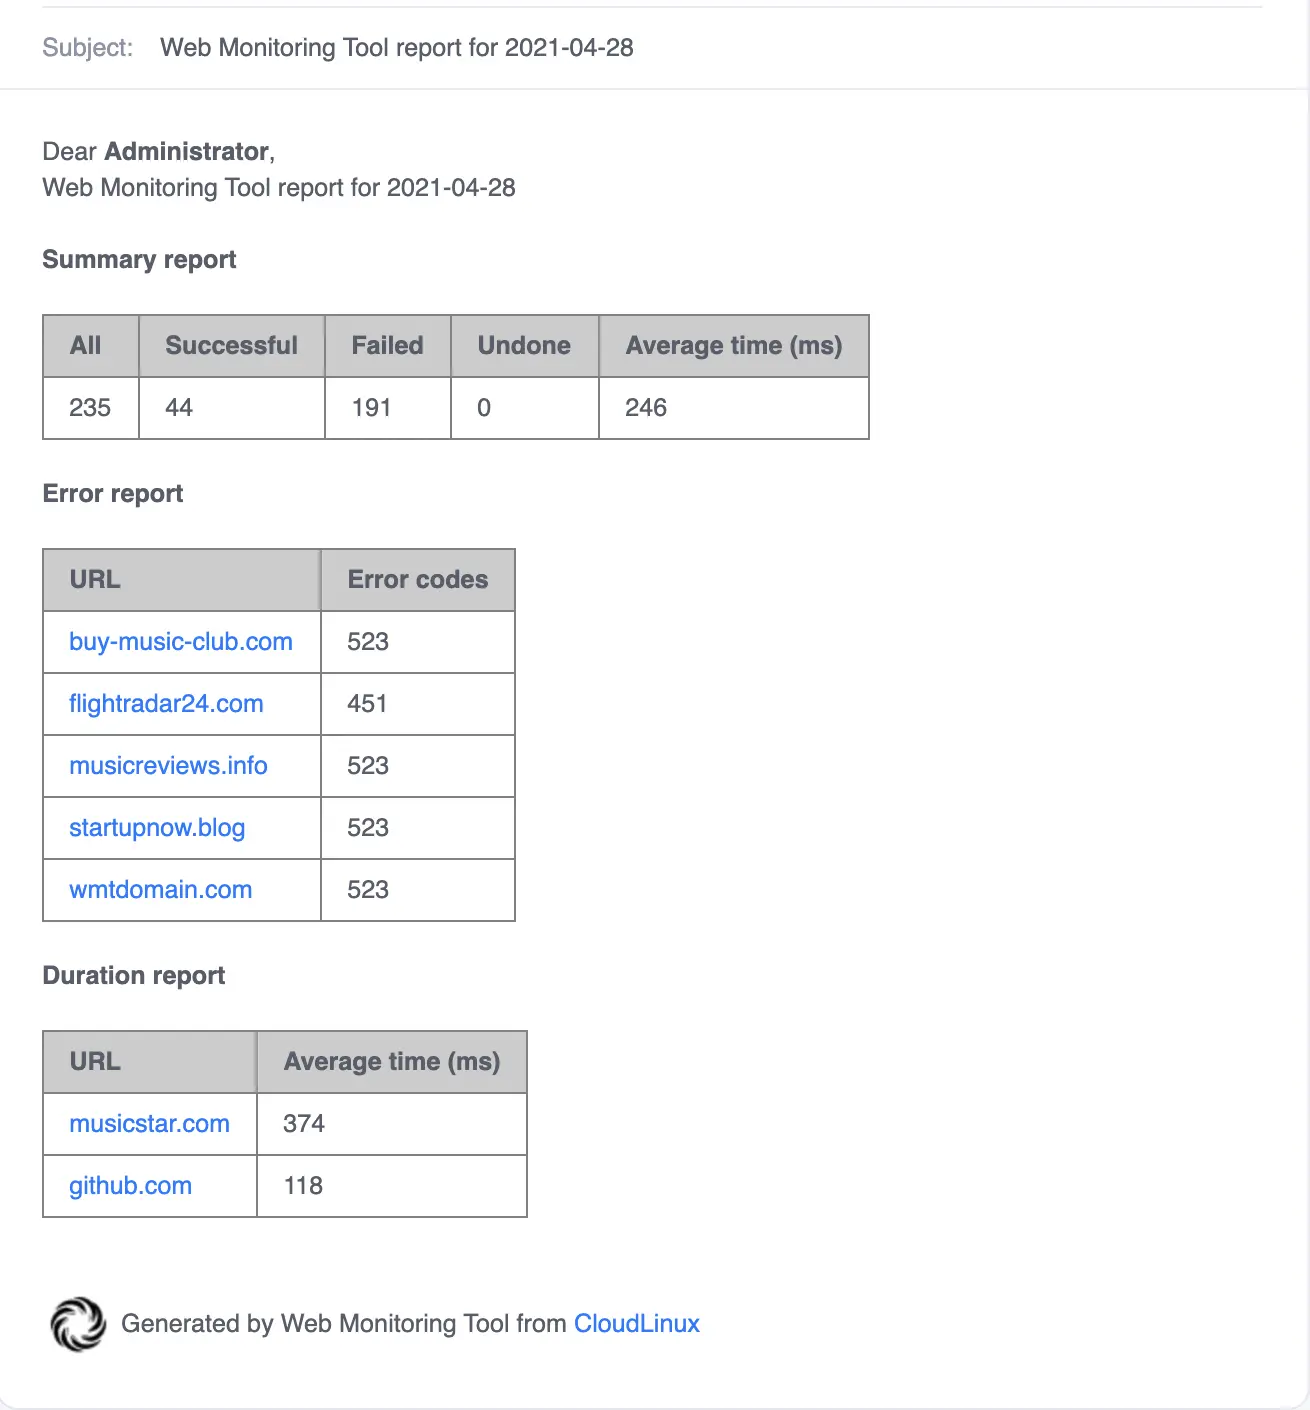
WMT email notifications
There are two types of emails sent by the Web Monitoring tool: daily email report and alert.
Daily email report
The summary report with all data for the previous day. It is created and sent every day at midnight.
Example of the Web Monitoring tools daily report.
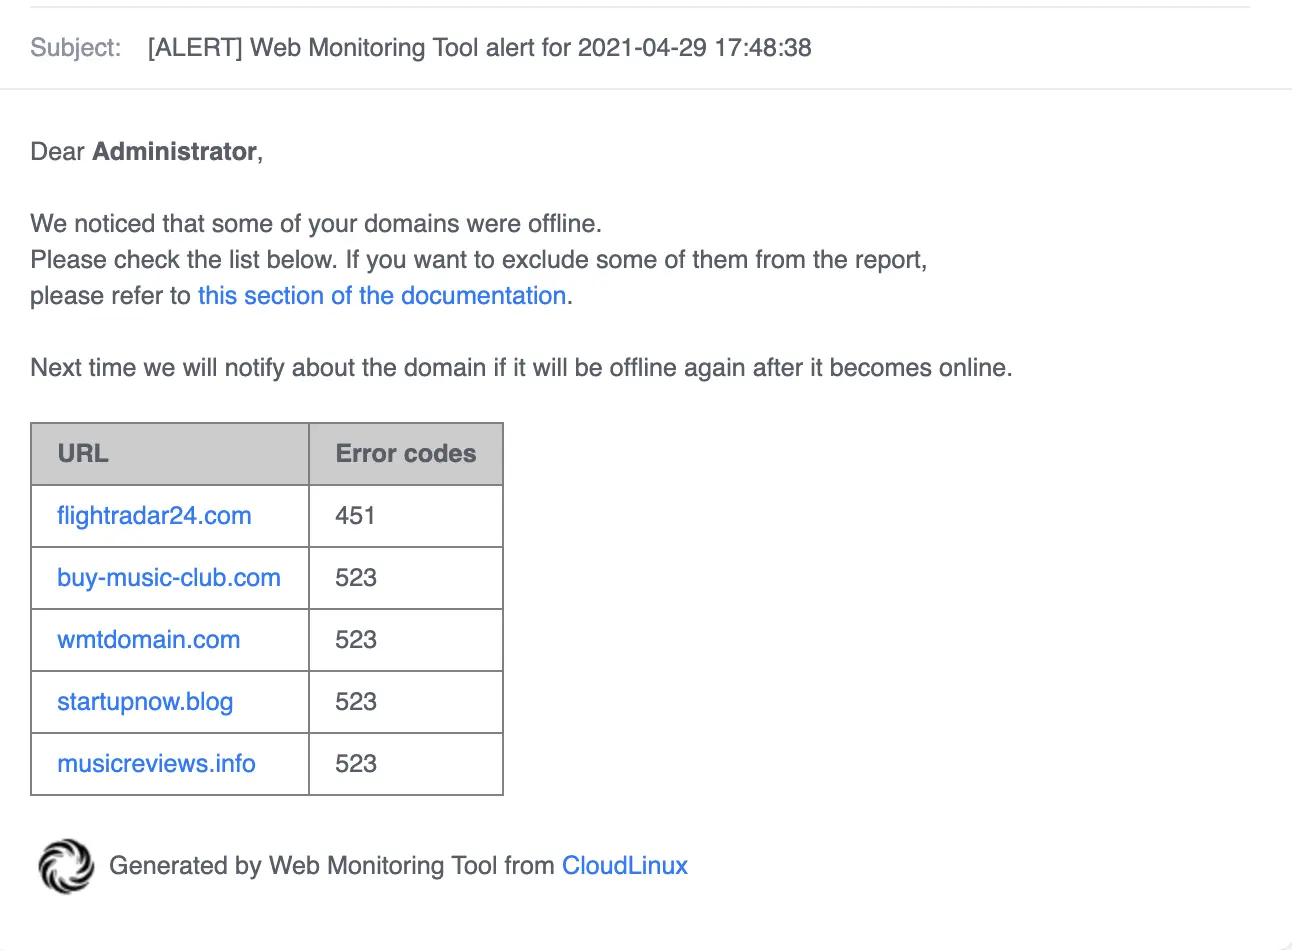
Alert
Domains that are responding with non-200 status code will be re-requested in 5 minutes or in the ping_interval setting (in case it is less than 5 minutes).
If domains are still responding with non-200 status code - Web Monitoring tool will inform about such domains with immediate alert email.
Example of the Web monitoring tools immediate alert.
Note
The next alert with domains will not be sent in less than 6 hours. Also, if the alerted domain is still responding with non-200 status code even after 6 hours - it will not be re-alerted until it responds with 200 status code at least once and becomes unavailable again.
PHP Slow Site analyzer
PHP Slow Site analyzer (SSA) is a tool that generates daily reports for the server administrator with information about the top N slow PHP-based URLs for all domains. The Slow Site analyzer tracks all PHP-based requests and selects slow ones by specific rules.
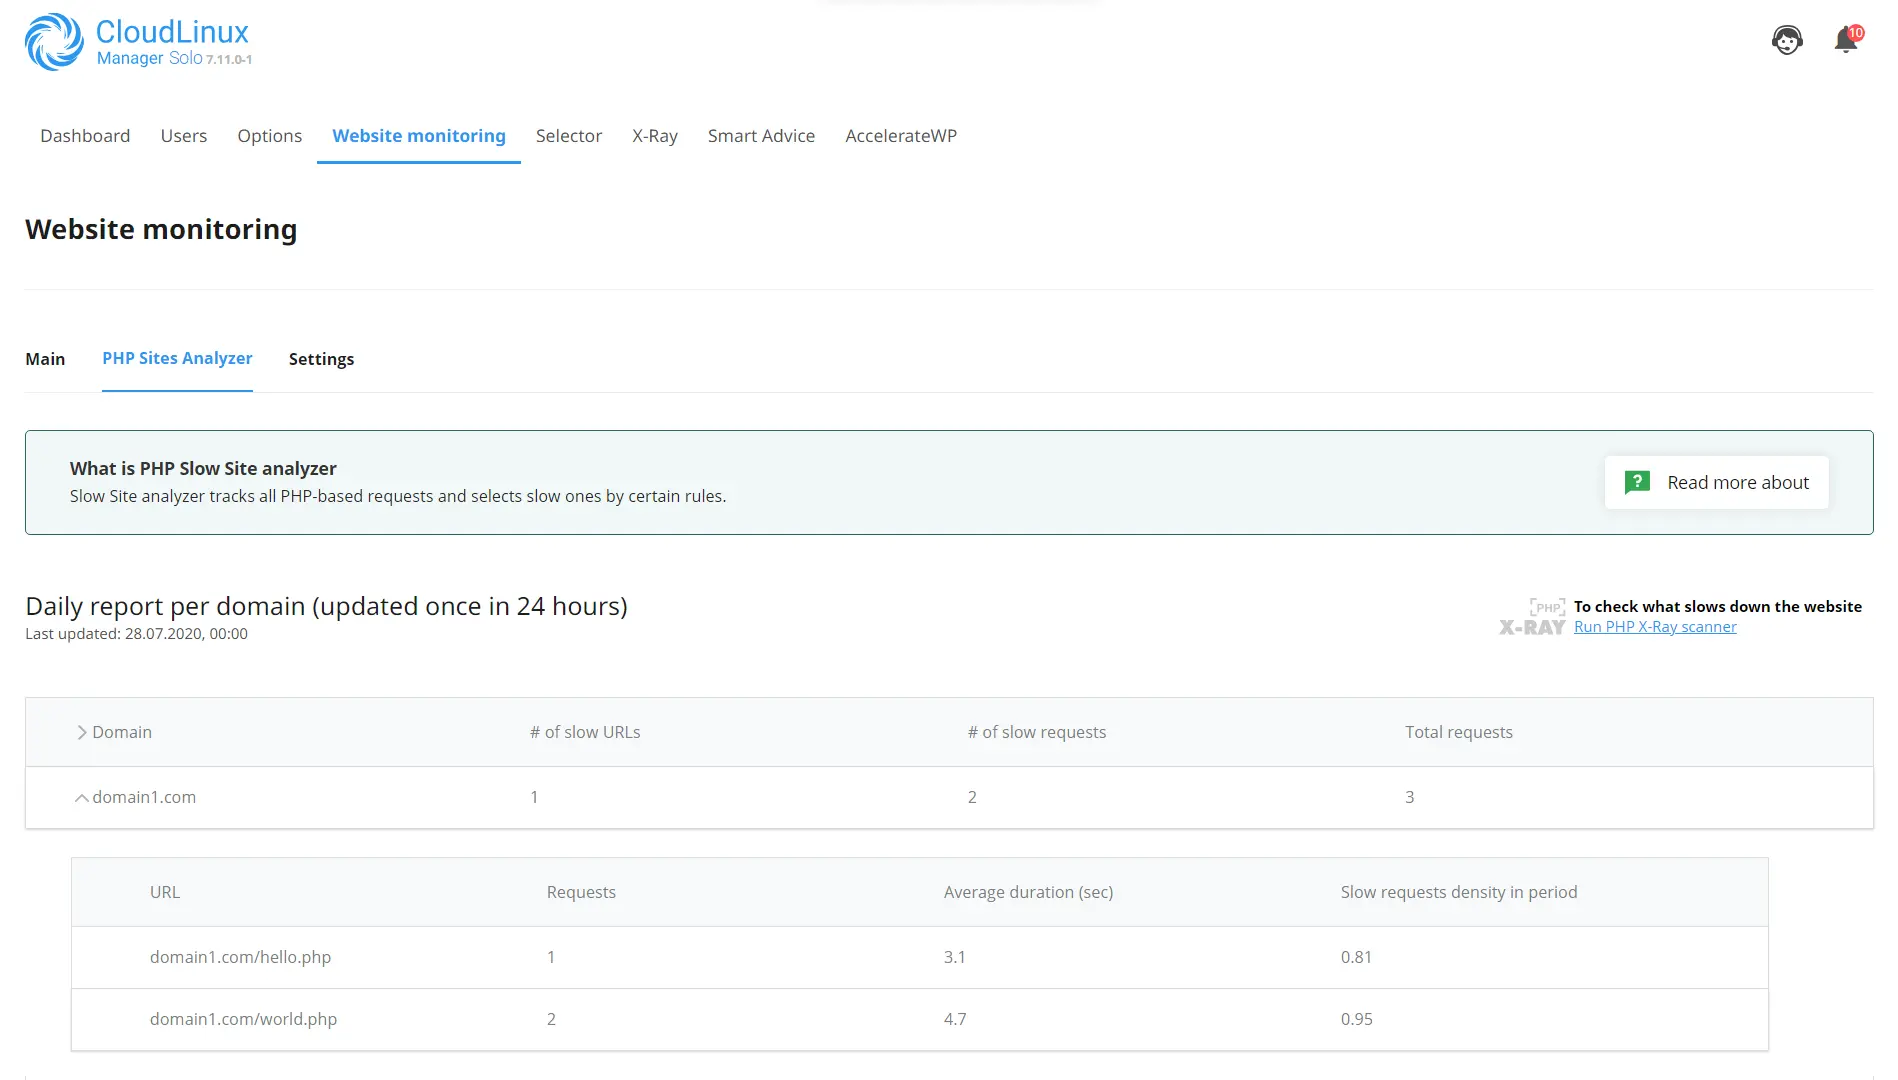
This is an example of a report from the Slow Site analyzer. The report shows the number of slow requests per domain and its URLs and the average duration of each slow URL.
SSA settings
To enable or disable the Slow Site analyzer, use the following slider:

The following settings can be changed through the UI:
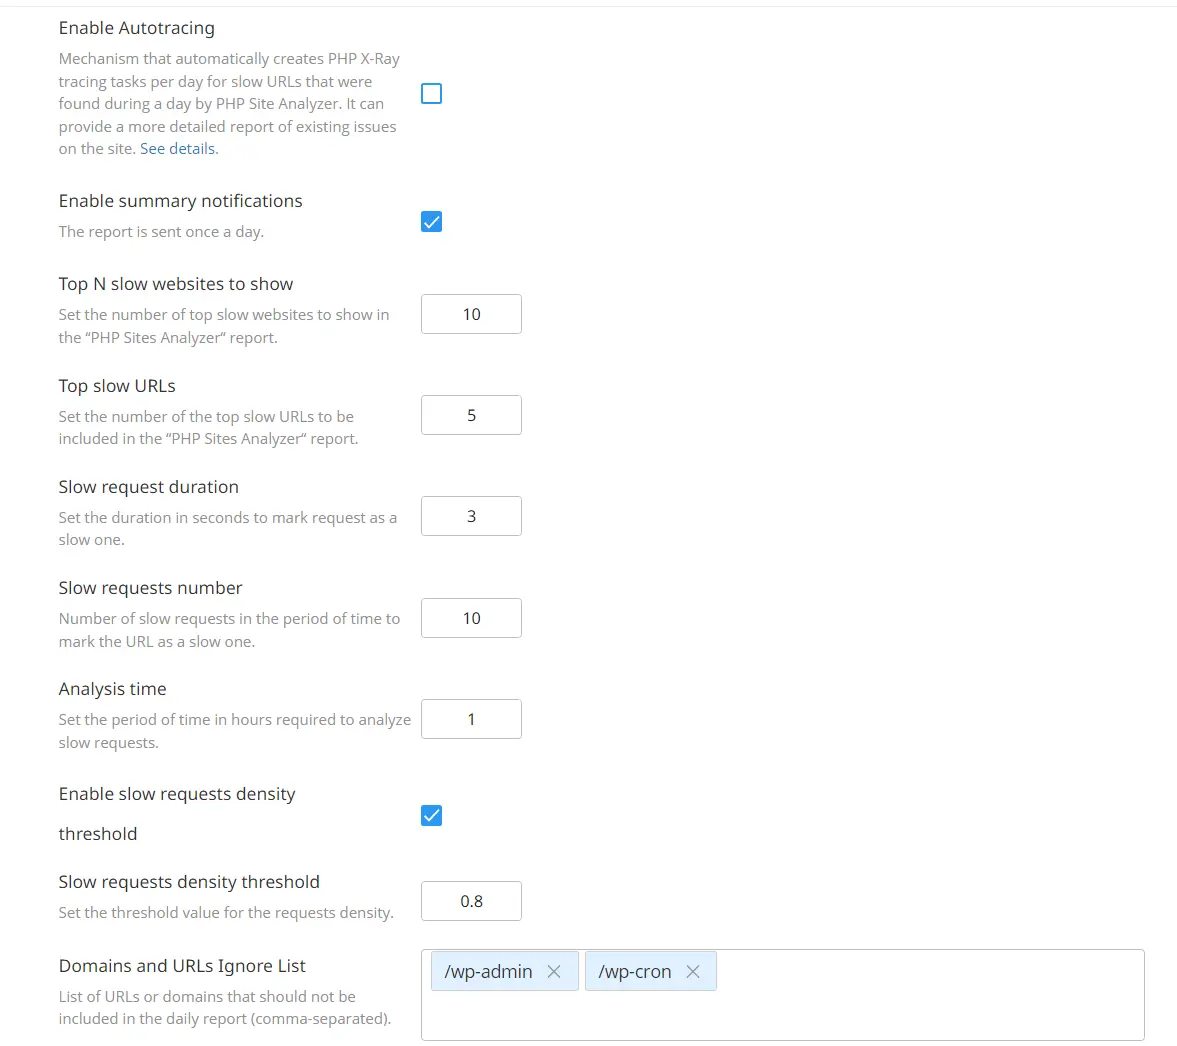
- Enable Autotracing - turn on/off Autotracing;
- Enable summary notifications - turn on/off summary daily email report notifications;
- Top N slow websites to show - Set the number of top slow websites to show in the “PHP Sites Analyzer“ report;
- Top slow URLs - this number (N) will be used to select the top N URLs for each domain, marked as slow;
- Slow request duration - the duration of a request in seconds. If the request duration was less than specified in this setting then this request will not be marked as slow;
- Slow requests number - number of slow requests in the period of time to mark the URL as a slow one;
- Analysis time - the period of time in hours required to analyze slow requests;
- Enable slow requests density threshold - turn on/off slow requests density threshold;
- Slow requests density threshold - can be in the interval [0..1], by default it is 0.8. The density threshold can be disabled. And the Domains and URLs Ignore List can be specified;
- Domains and URLs Ignore List - domains and URLs that will not be displayed in reports;
SSA CLI
The cloudlinux-ssa-manager utility allows to manage Slow Site analyzer via CLI.
Usage
/usr/sbin/cloudlinux-ssa-manager [command] [--optional arguments]
Optional arguments:
-h, --help | show help message and exit |
Commands:
set-config | set the SSA configuration |
get-config | get the SSA configuration |
get-ssa-status | get a current status of SSA |
enable-ssa | enable SSA |
disable-ssa | disable SSA |
get-report | get the latest report |
You can use the -h, --help option with commands to get a full list of available optional arguments for each command.
Example of the /usr/sbin/cloudlinux-ssa-manager get-report | json_reformat command output:
/usr/sbin/cloudlinux-ssa-manager get-report | json_reformat

{
    "result": "success",
    "date": "18.05.2021",
    "domains": [
        {
            "name": "user1.com",
            "slow_urls": 2,
            "slow_reqs": 23,
            "total_reqs": 24,
            "urls": [
                {
                    "name": "http://user1.com/",
                    "reqs_num": 13,
                    "average_duration": 3004509
                },
                {
                    "name": "http://user1.com/info.php",
                    "reqs_num": 10,
                    "average_duration": 3641018
                }
            ]
        },
        {
            "name": "user2.com",
            "slow_urls": 1,
            "slow_reqs": 12,
            "total_reqs": 12,
            "urls": [
                {
                    "name": "http://user2.com/",
                    "reqs_num": 12,
                    "average_duration": 3010571
                }
            ]
        }
    ]
}
Example of the /usr/sbin/cloudlinux-ssa-manager set-config --requests-duration 2.5 command output:
/usr/sbin/cloudlinux-ssa-manager set-config --requests-duration 2.5

{"result": "success"}
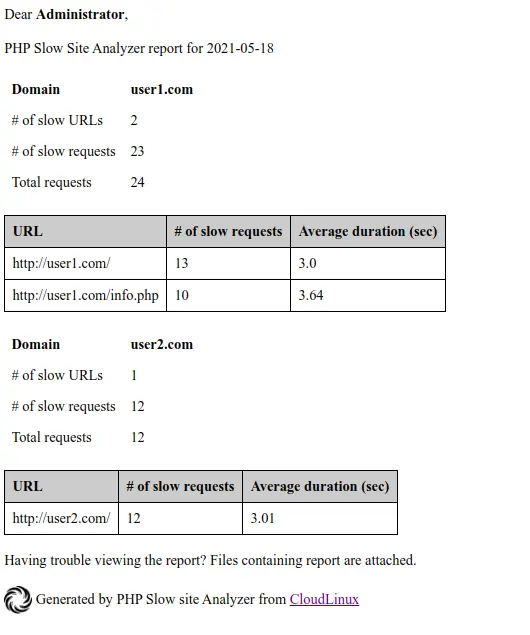
SSA email notifications
SSA sends email reports daily if the "Enable summary notifications" setting is turned on.
Example of the PHP Slow Site analyzer report:
X-Ray
- Description
- How to manage X-Ray
- Managing tracing task
- Managing continuous tasks
- X-Ray Autotracing
- End-user X-Ray plugin
- X-Ray client
- X-Ray service
- FAQ
Description
X-Ray is a tool developed for website performance monitoring and performance issues detection.
X-Ray can gather and visualize information about top N slowest system functions, external requests, software modules and database queries of the website.
How to manage X-Ray
X-Ray provides two options for monitoring domain requests speed: Tracing task and Continuous task.
Tracing task is a task created manually for a specific URL to collect server requests. The task will end either after a specified number of requests to the URL or after a specified time (maximum after two days). It is not possible here to automatically email a report but it is possible to export the report in PDF and send to a user.
Continuous task is a task that initiates a daily hourly tracing requests for a specified domain and email a monitoring report. Continuous task can't stop automatically, you need to stop it manually.
In fact, continuous task allows to automatically create a tracing task for each new day, with the ability to get a report for the past day.
X-Ray serverwide mode
With X-Ray v0.6-11 we introduced global X-Ray mode which enables tracing extension for all PHP versions on the servers. This mode allows your customers to override PHP versions in different folders and trace websites located in those folders.
In order to enable this mode, type the following command:
cloudlinux-xray-manager enable-serverwide-mode
In order to get back to default:
cloudlinux-xray-manager disable-serverwide-mode
Enable and disable commands do not stop or remove tracing tasks.
X-Ray phpinfo mode
With X-Ray v0.6-18 we introduced new X-Ray mode which gathers website php version using information from phpinfo. This mode allows your customers to override PHP versions
In order to use this mode, websites should be reachable through http or https.
In order to enable this mode, type the following command:
touch /opt/cloudlinux/flags/enabled-flags.d/xray-per-domain-php-version-mode.flag
In order to get back to default:
rm -f /opt/cloudlinux/flags/enabled-flags.d/xray-per-domain-php-version-mode.flag
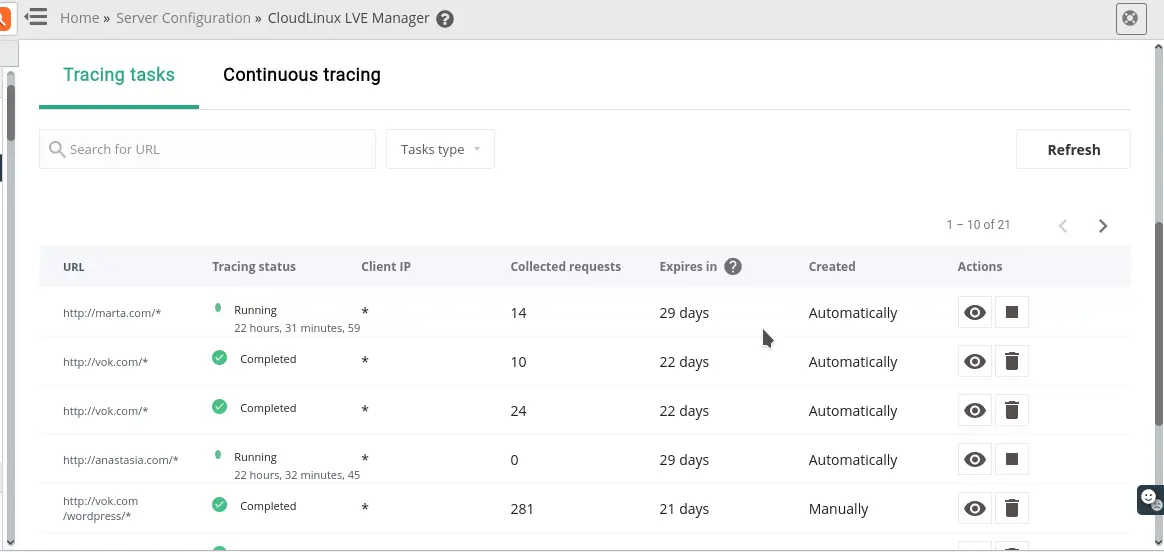
Tracing tasks tab
The Tracing tasks tab contains a list of all tracing tasks created both manually and automatically via continuous tasks.
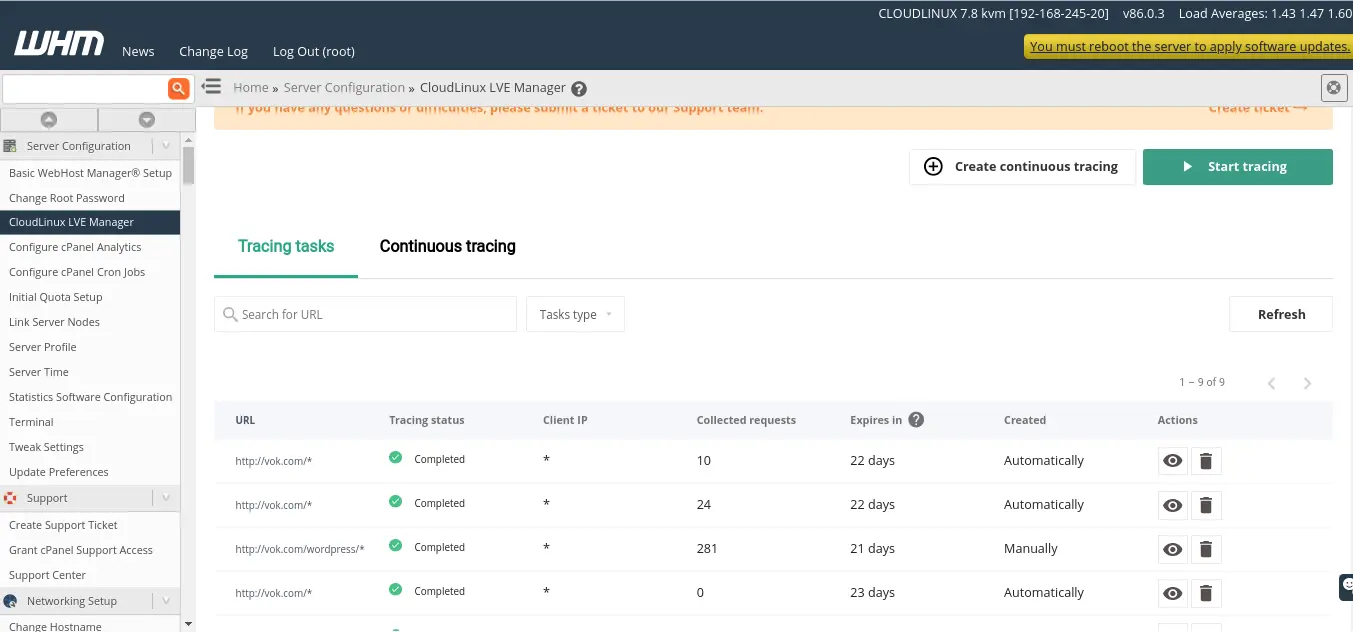
The Created column shows how a task was created – automatically (by continuous task) or manually.
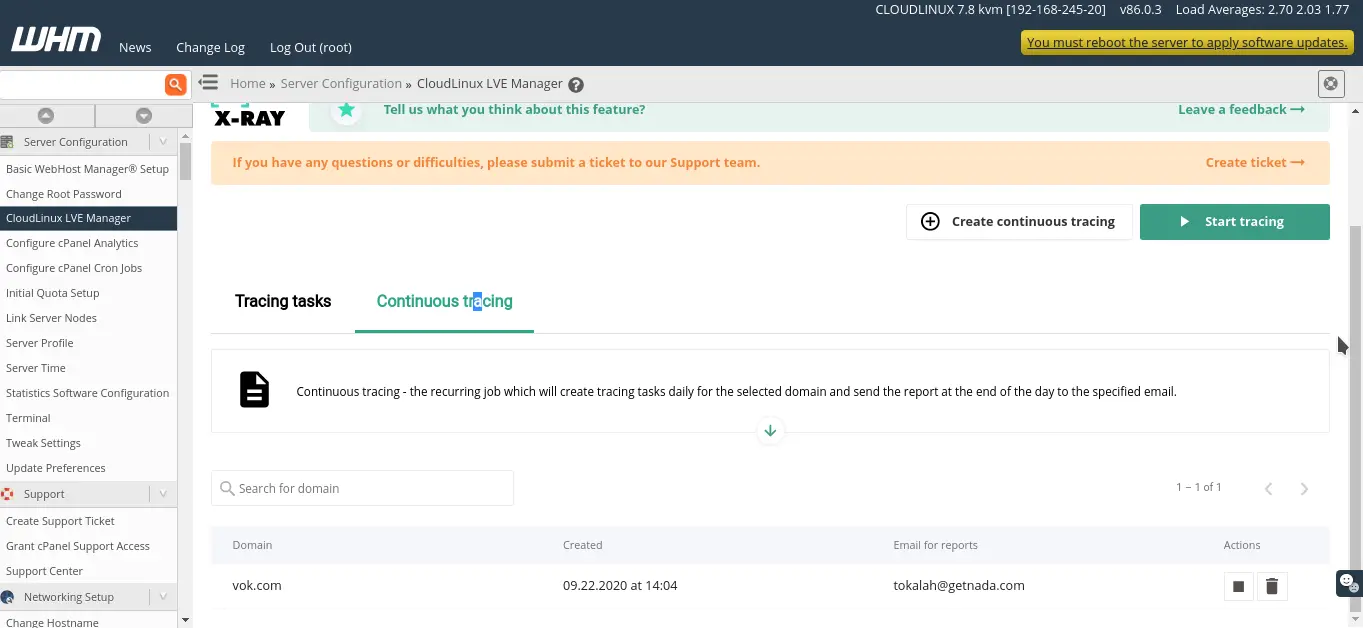
Continuous tracing tab
The Continuous tracing tab contains a list of continuous tasks for which tracing tasks will be created automatically for a new day for a specific domain.

Managing tracing task
Creating a new tracing task
- Go to the X-Ray tab
- Click the Start tracing button to create a new task
- In the opened popup specify a website URL to trace
- Click the Run button
- Tracing will run in the default mode. In the default mode X-Ray traces the first 20 requests for a specified URL
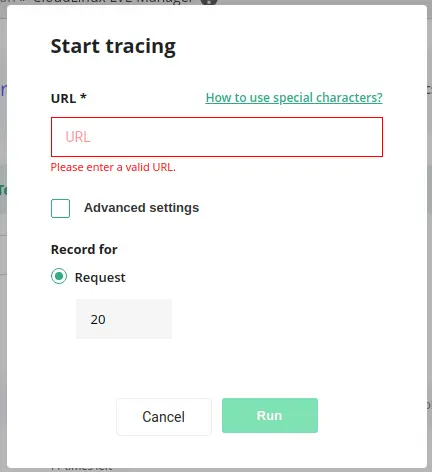
URL should be a valid URL of the domain which exists on the current hosting server. The URL field supports wildcard matching. To learn more about wildcard matching, click How to use special characters.
Advanced settings allow you to set an IP address and tracing options: by time or by number of queries.
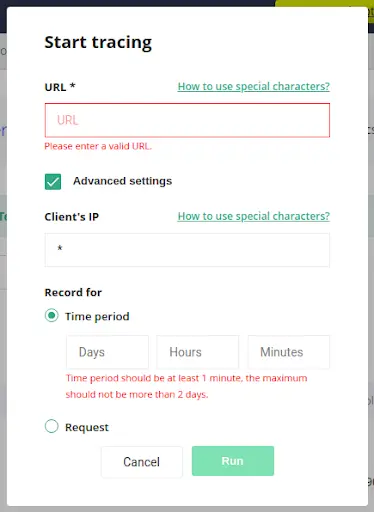
Advanced settings
- Client’s IP: it is an IPv4 address of a machine to trace. For example, if you have a production website that processes requests from different IP addresses and you do not want to add these requests to the tracing task. So, you can set a specific IP address and X-Ray will analyze requests only from this specific IP address. Record for
- Time period: how much time X-Ray collect the requests (2 days max)
- Requests: the amount of requests that X-Ray will collect
After creating, the task appears in the list of tracing tasks.
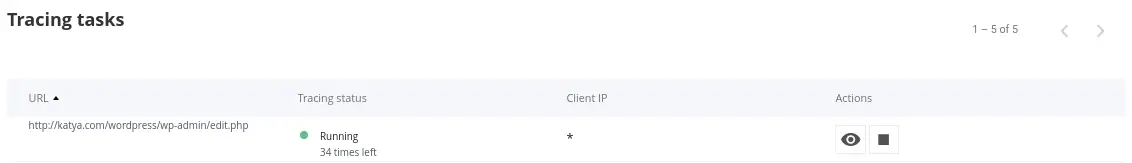
Viewing tracing tasks list
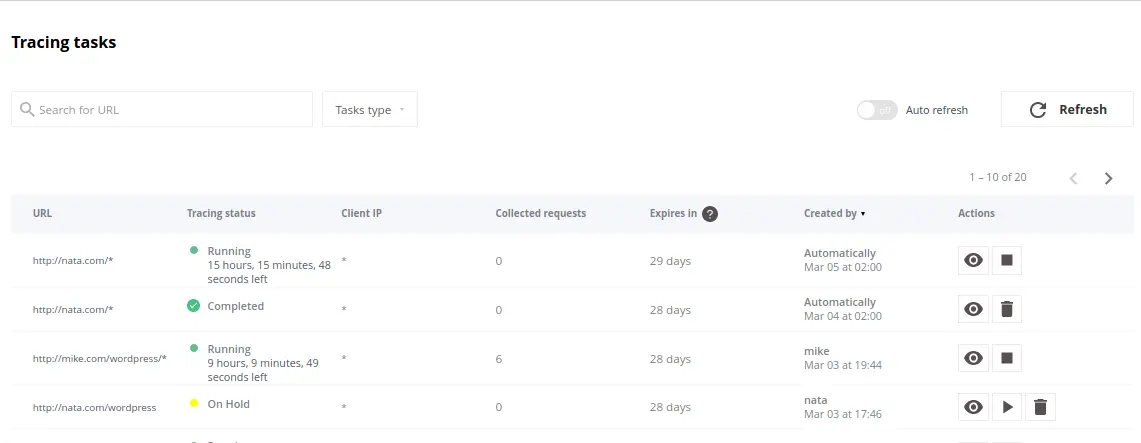
Tasks created Manually are simply tracing tasks.
Tracing status
A tracing task can have the following statuses:
- Running – tracing is in progress
- Stopped – tracing was stopped by administrator
- On hold – the same URL already exists in the lists. Task processing will not start automatically. Administrator should start it manually.
- Completed – period of time is finished or number of requests is reached.
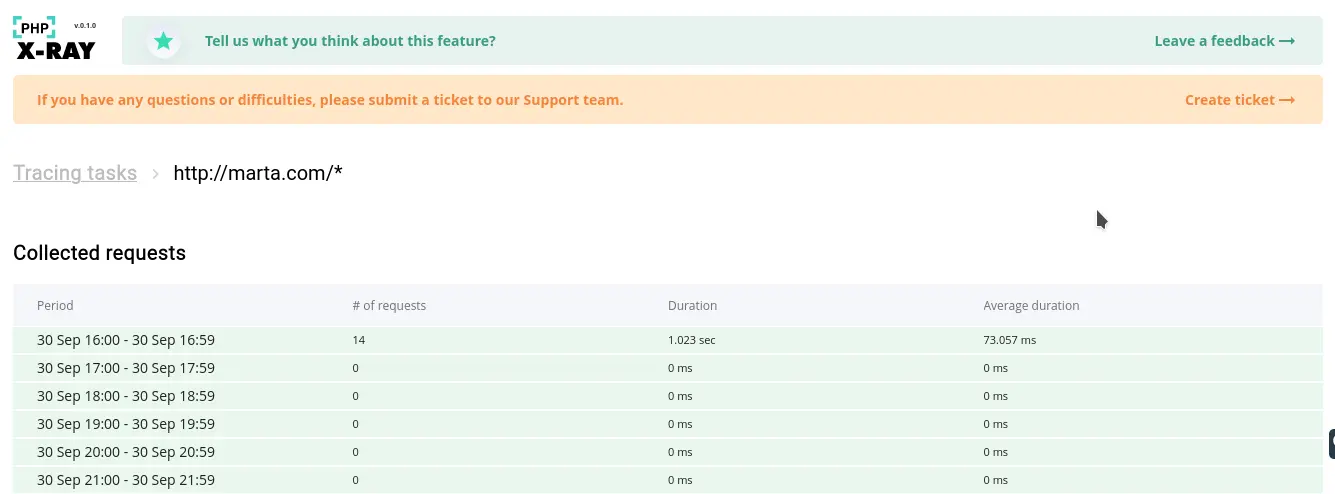
Collected requests for tracing task
Warning!
Collected requests are available in the UI for two weeks.
Click  to open a list of collected requests.
Tracing tasks
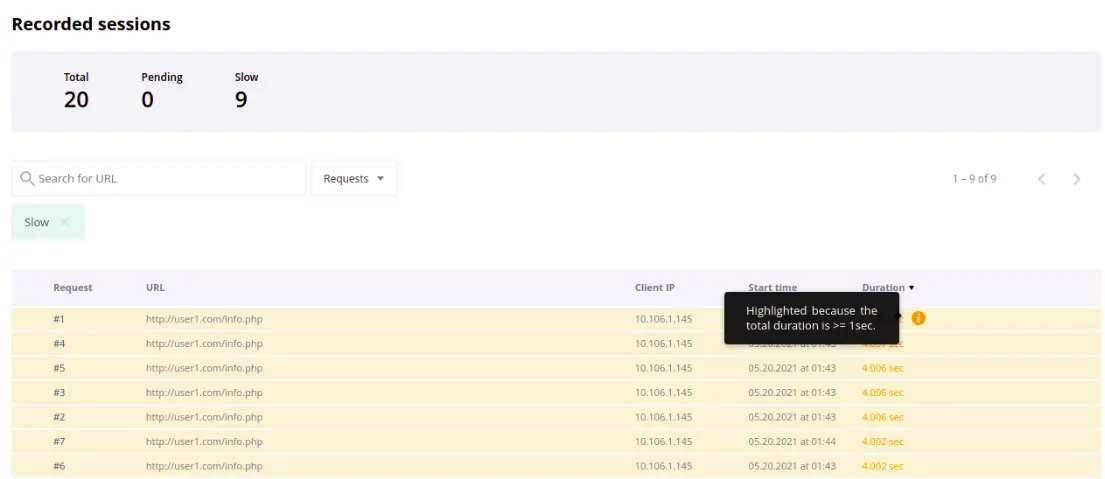
The slowest request is highlighted.

- Total displays how many requests were collected according to tasks requirements.
- Pending displays how many of collected requests are not visible in the table yet.
- Slow displays the number of requests lasting more than one second.
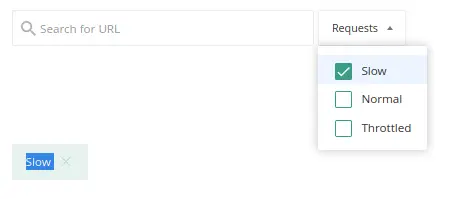
There are filters for the request types and the indicator of a filter used now.
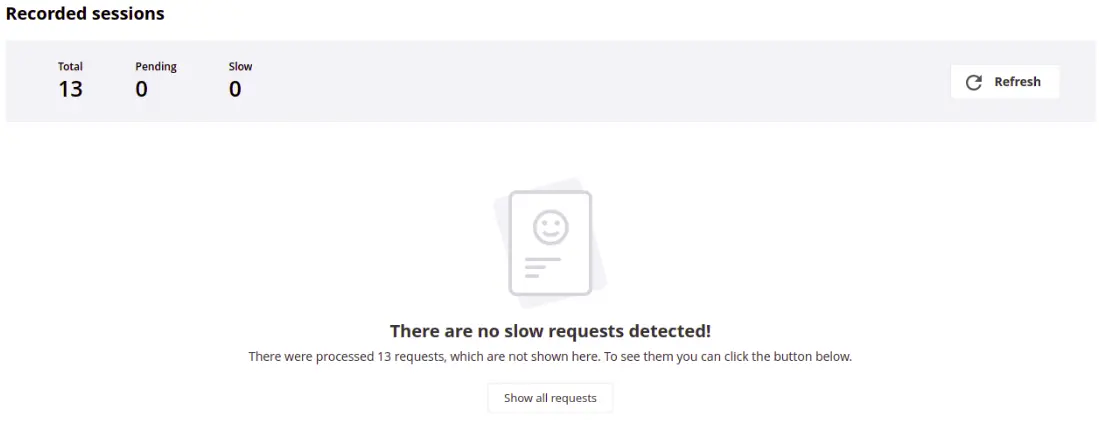
If slow requests were not detected during the tracing task, the following is displayed. Here, you can also view all requests.
X-Ray collects the following data for each request:
- Top issues – the slowest items of a request
- Software modules/plugins by execution time (only for WordPress plugins)
- Database queries by execution time
- External requests by execution time
- Other system functions by execution time
Software modules/plugins
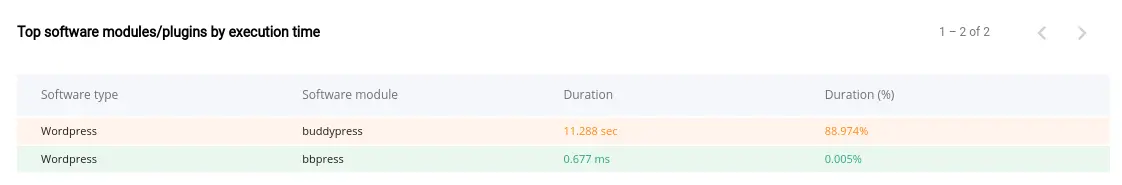
The Software modules/plugins section displays the following data:
- Software type – a type a module/plugin. For now, X-Ray can analyze only WordPress software
- Software module – a name of the WordPress plugin
- Duration – plugin execution time
- Duration (%) – plugin execution time as a percentage of the total duration of the request
Database queries
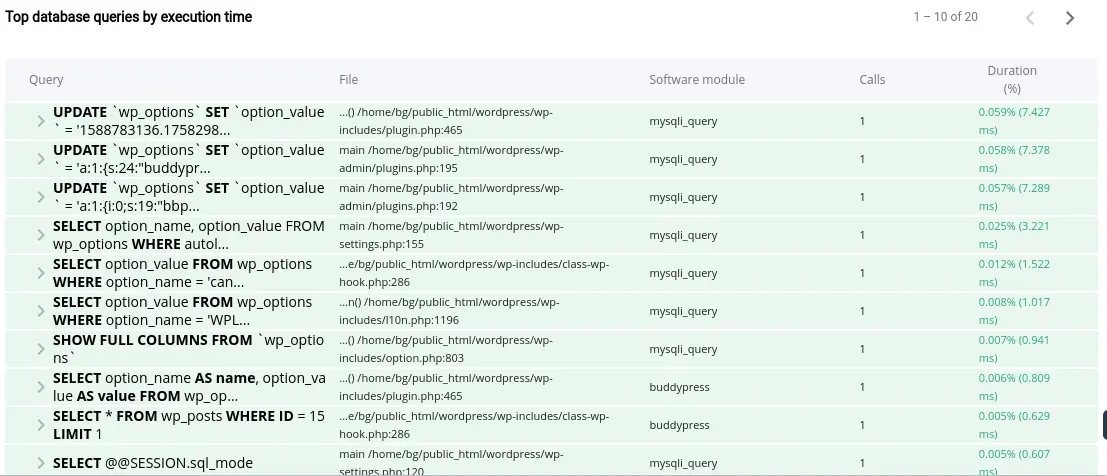
The Database queries section displays the following data:
- Query – the executed SQL-query
- File – the file and the line of the executed query and backtrace
- Software module – a WordPress plugin name from which the request was completed. If the request does not belong to any of the WordPress plugin, the name of the function that executed the given request is displayed
- Calls – the number of identical SQL queries
- Duration – execution time as a percentage of the total duration of a request and the function processing time (in brackets)
External requests
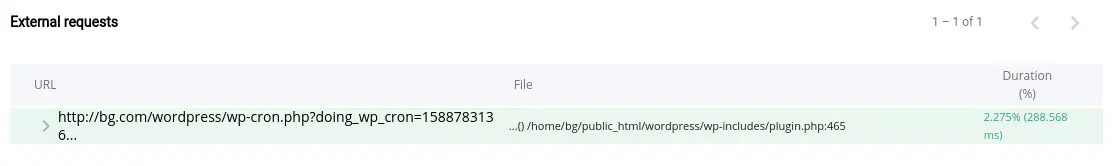
The External requests section displays the following data:
- URL – the URL of the executed request
- File – the file and the line of the executed request and backtrace
- Duration – execution time as a percentage of the total duration of a request and the function processing time (in brackets)
System functions
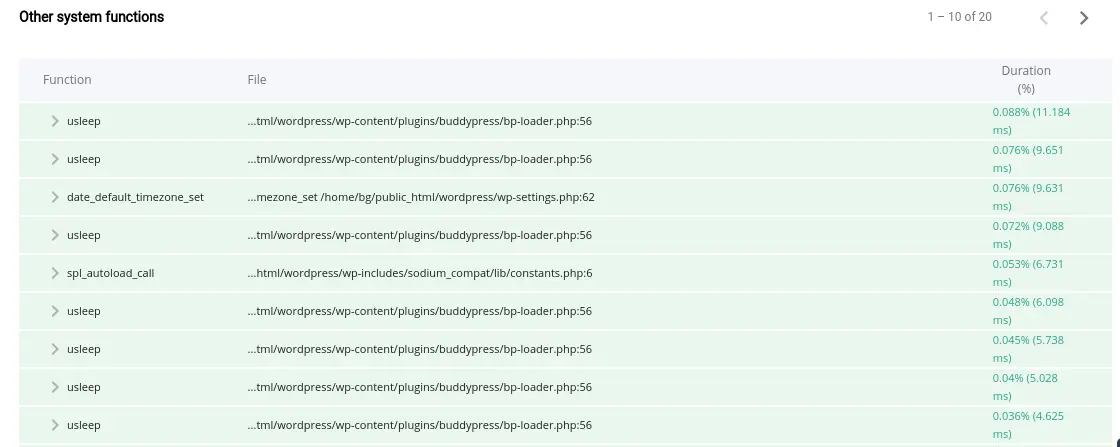
The System functions section displays the following data:
- Function – the executed function
- File – the file and the line of the executed request
- Duration – execution time as a percentage of the total duration of a request and the function processing time (in brackets)
Stopping tracing task
Click  to stop the tracing task.

The tracing task status will be changed to Stopped. Data will not be collected anymore but you can see already collected information or continue tracing later by clicking  .
.
Deleting tracing task
Click  to delete the tracing task.
Warning!
When you have deleted a tracing task, all collected data will be unavailable.
Managing continuous tasks
Creating a new continuous task
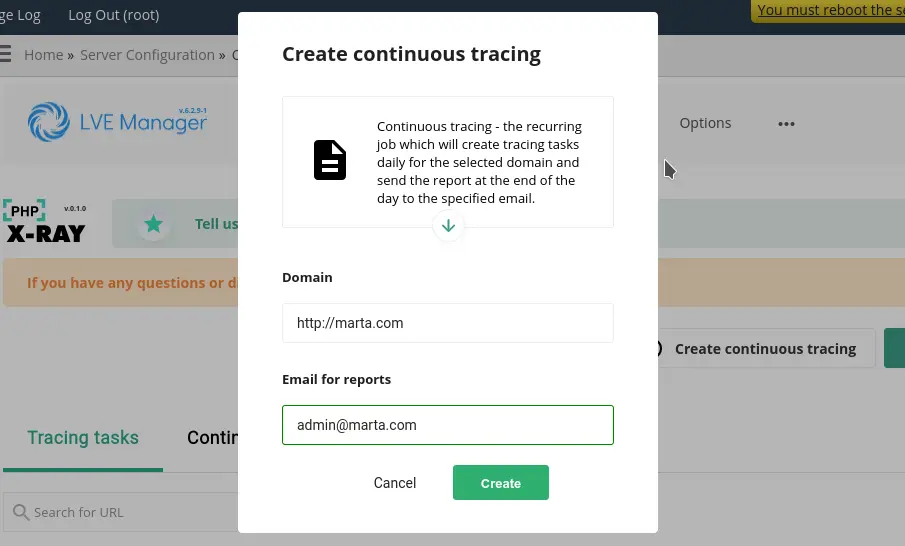
- Click the Create continuous tracing button
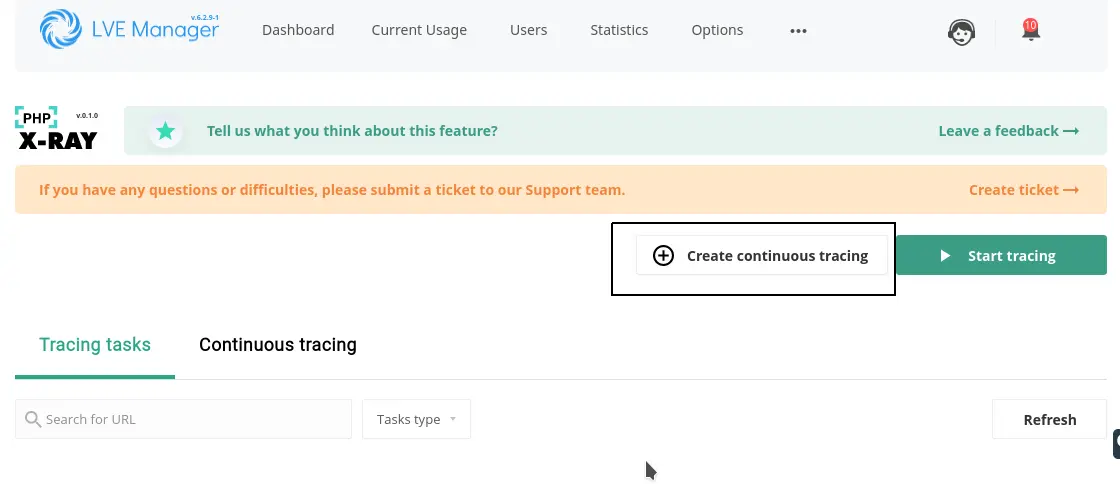
- Specify URL in the Domain field and email in the Email for reports field and click the Create button.
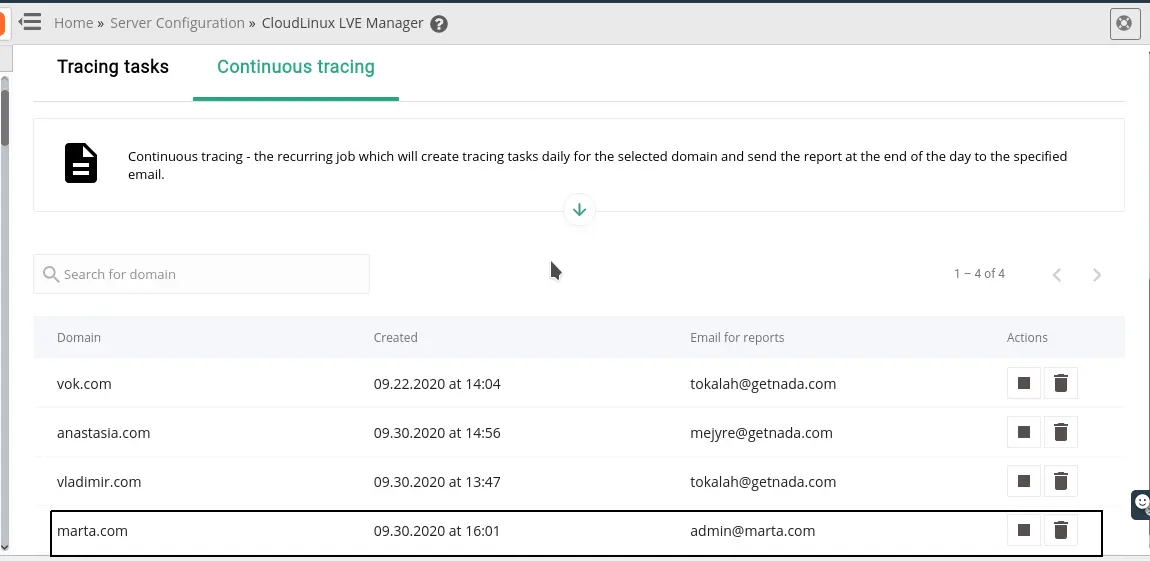
- You can see a new task in the Continuous tracing tab in the X-Ray UI.
If you stop a continuous tracing task, a new task for the next 24 hours will not be created. The task for the current day will be finished at midnight and the report will be emailed.
If you delete a continuous tracing task, the task for the current day will be finished at midnight and the report will be emailed.
Viewing continuous tasks list
You can find a list of continuous tracing tasks in the Continuous tracing tab.
You can find automatically created tasks in the Tracing tasks tab marked as Automatically in the Created column.
The statuses for automatically created tasks are the same as for tracing task.
To view detailed info about an automatically created task, click  . You will get requests grouped by hour.
Click to a group to open a list of the requests.
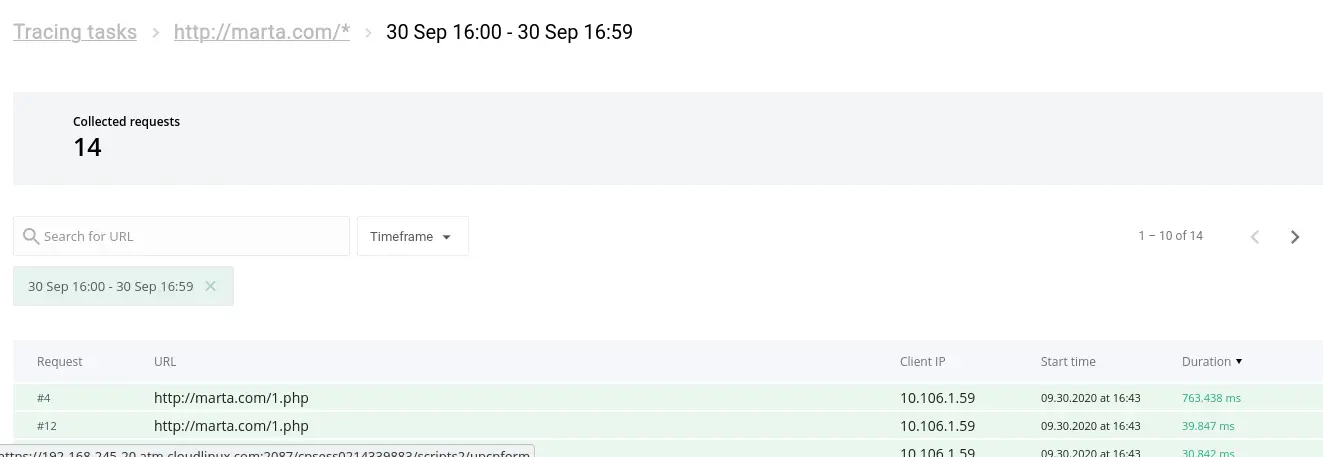
The following data is collected for each request:
- Software modules/plugins by execution time (only for WordPress plugins)
- Database queries by execution time
- External requests by execution time
- Other system functions by execution time
Stopping automatic tracing task
Stopping automatic tracing task (a part of continuous tracing task) affects only the automatic tracing task for the current day. A new task for the next day will be created at the end of the day.
To stop the continuous tracing task completely, see Creating a new continuous task, paragraph 4.
Deleting automatic tracing task
Deleting automatic tracing task (a part of continuous tracing task) affects only the automatic tracing task for the current day. A new task for the next day will be created at the end of the day.
To delete the continuous tracing task completely, see Creating a new continuous task, paragraph 5.
Continuous task daily report
Users get daily reports on their emails. An example of a report is shown below:

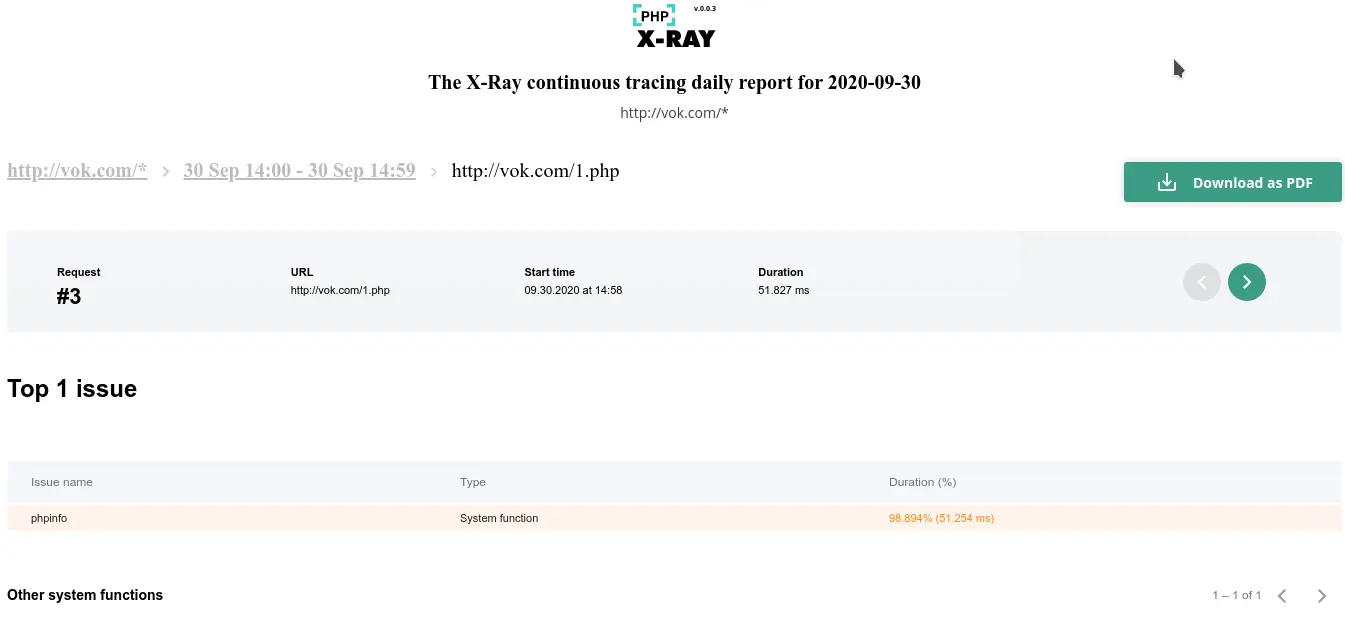
Click the link in the email to show the detailed report:
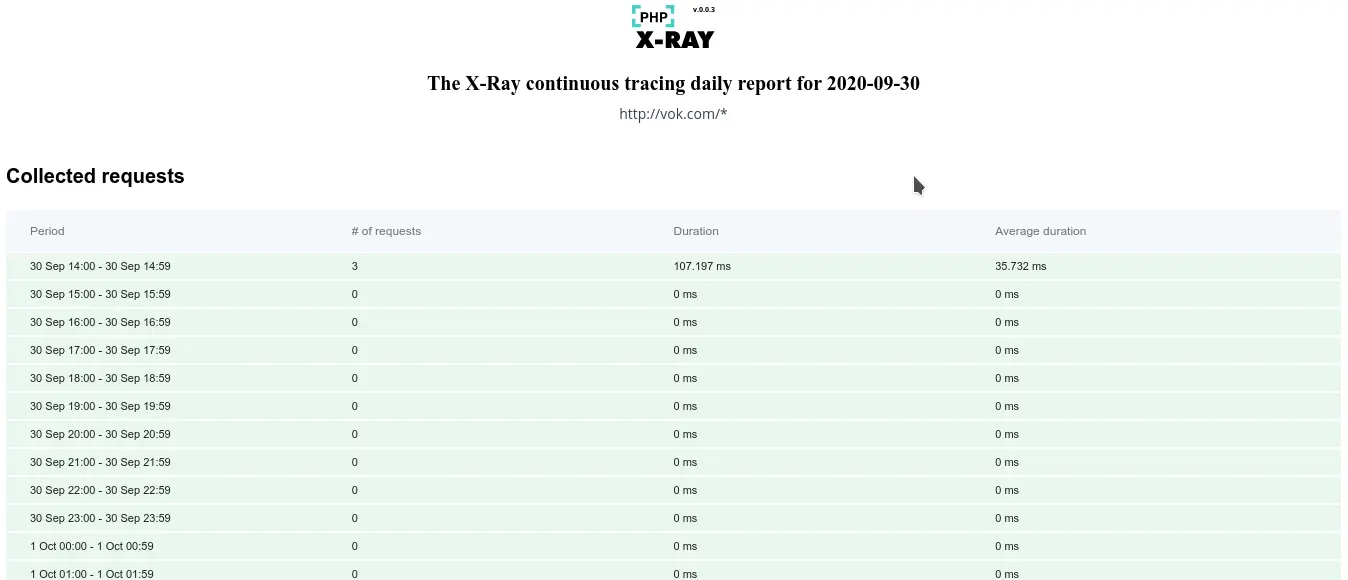
You can view requests grouped by hour:
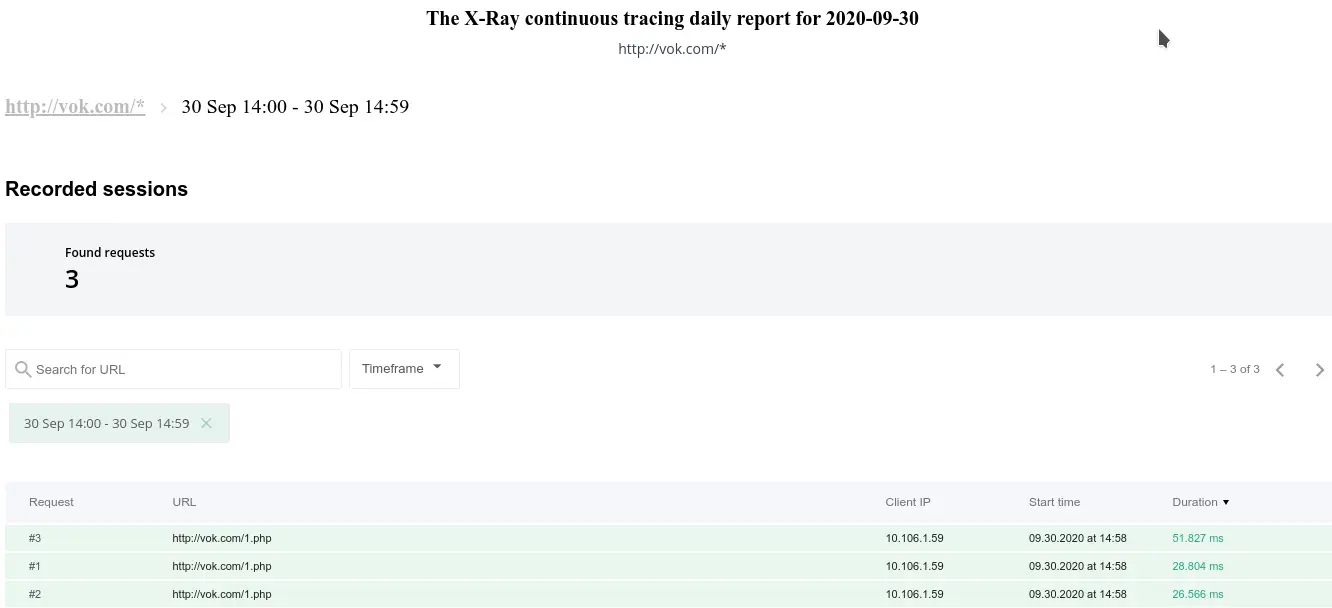
You can also view the detailed information about request:
X-Ray Autotracing
X-Ray Autotracing automatically creates tracing tasks for slow URLs that were found during a day by the PHP Slow Site Analyzer (SSA).
Warning
To use X-Ray Autotracing, update your alt-php-ssa and alt-php-xray packages to versions alt-php-ssa-0.2-1 and alt-php-xray-0.4-1 or higher by running the following command:
yum update alt-php-ssa alt-php-xray --enablerepo=cloudlinux-updates-testing
How to enable X-Ray Autotracing
To enable X-Ray Autotracing, run the following commands via SSH:
/usr/sbin/cloudlinux-ssa-manager enable-ssa
/usr/sbin/cloudlinux-xray-autotracing enable --all
Check CLI documentation for a description of the /usr/sbin/cloudlinux-xray-autotracing CLI utility.
Requirements
- CloudLinux OS Shared Pro or CloudLinux OS Solo
- alt-php-ssa > 0.2-1 version
- alt-php-xray > 0.4-1 version
- Enabled PHP SSA on the server
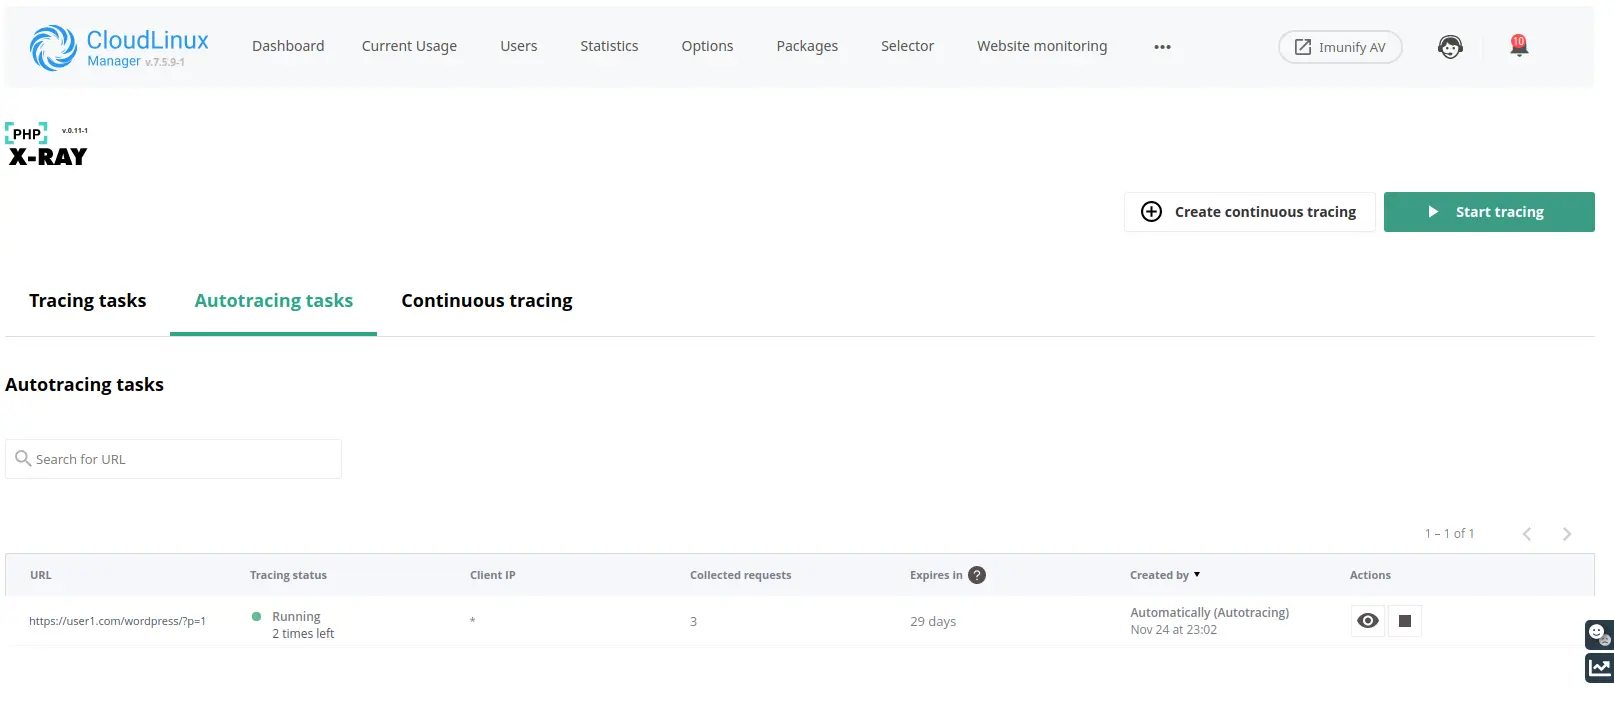
Autotracing Interface
A new tab for Autotracing tasks was added to the X-Ray UI:
Autotracing FAQ
Q: Why are the slow URLs in the Slow Site Analyzer report different from those on which the autotracing tasks were created?
A: Because the autotracing decision module uses rules and thresholds different from Slow Site Analyzer, which are configured by the CloudLinux team.
Q: How often autotracing tasks will be generated?
A: Once a day at the same time as a Slow Site Analyzer report.
X-Ray Autotracing CLI
The cloudlinux-xray-autotracing utility allows to manage the X-Ray Autotracing via CLI.
Usage
/usr/sbin/cloudlinux-xray-autotracing [command] [--optional arguments]
Commands:
enable | Enable X-Ray Autotracing |
disable | Disable X-Ray Autotracing |
status | Get current status of the X-Ray Autotracing |
Optional arguments:
-h, --help | Show help message and exit |
--all | Enable or disable for all users |
{username} | Enable/disable the specified user |
--list-disabled | Show list of disabled users |
You can use the -h, --help option with commands to get a full list of available optional arguments for each command.
Example usage:
Disable user1:
/usr/sbin/cloudlinux-xray-autotracing disable user1

{"result": "success"}
Show list of disabled users:
/usr/sbin/cloudlinux-xray-autotracing status --list-disabled

{"result": "success", "disabled_users": ["user1"]}
Enable all:
/usr/sbin/cloudlinux-xray-autotracing enable --all

{"result": "success"}
X-Ray Smart Advice
Smart advice is a new feature of X-Ray that is designed to find and propose solutions to fix performance issues and speed up the performance of a sites.
Note
Smart Advice will work only for CloudLinux OS Solo servers with cPanel or Plesk Control Panel for now.
At the moment, Smart Advice is focused only on WordPress sites.
Warning
To use X-Ray Smart Advice, update your alt-php-ssa and alt-php-xray packages to versions alt-php-ssa-0.2-3 and alt-php-xray-0.5-1 or higher by running the following command:
yum update alt-php-ssa alt-php-xray lve-utils lvemanager --enablerepo=cloudlinux-updates-testing
Requirements
- CloudLinux OS Shared Pro or CloudLinux OS Solo
- alt-php-xray > 0.5-1 version
- lve-utils > 6.3.2-1 version
- lvemanager > 7.6.1-1 version
- cloudlinux-site-optimization-module > 0.1-1 version
We Recommend:
- Enable X-Ray Autotracing on the server
- Use alt-php-ssa > 0.2-3 version
How X-Ray Smart Advice works
The main process of looking for advice is X-Ray tracing tasks. The best way for doing this is to enable X-Ray Autotracing. This will allow you to most effectively find Smart Advice for sites that have performance issues without your manual participation. You can find information on how to enable X-Ray Autotracing here. On the other hand, you can create tracing tasks manually or use continuous X-Ray but we suggest you use X-Ray Autotracing for this purpose.
Note
Advice will not be generated by old tracing tasks.
While the tracing task is running, X-Ray will look for places where advice can be applied. New advice will be displayed on the Smart Advice tab.
Smart Advice FAQ
Q: Why I can't see new advice on the Smart Advice tab?
A: For the generating of advice, it is necessary to run X-Ray tracing tasks, the best way to do it without manual interaction is to use X-Ray Autoracing. You can find more information on how to enable X-Ray Autotracing here.
Useful Smart Advice CLI commands
Warning!
This is an experimental feature. The backwards compatibility is not guaranteed.
To obtain the full list of advice generated for your server use the following CLI command:
cl-smart-advice list
For each advice in the list the CLI command returns the following information:
metadata, which includes information aboutusername,domainandwebsitefor which the advice is issuedadviceinformation:- its identifier
id - its
type - its
status--revieworapplied - if advice is Premium
is_premium - other internal informational fields
- its identifier
The example output is given below:
{
  "data": [
    {
      "created_at": "2023-04-11T07:33:48.191870+00:00",
      "updated_at": "2023-04-11T07:33:48.191870+00:00",
      "metadata": {
        "username": "user16",
        "domain": "user16.com",
        "website": "/wordpress"
      },
      "advice": {
        "id": 23484,
        "type": "OBJECT_CACHE",
        "status": "review",
        "description": "Turn on Object Caching",
        "is_premium": true,
        "module_name": "object_cache",
        "subscription": {
          "status": "no",
          "upgrade_url": null
        },
        "total_stages": 0,
        "completed_stages": 0,
        "detailed_description": "To improve site performance, enable the Object Caching We recommend applying the advice if you see it frequen
tly for the most valuable URLs of your site."
      }
    },
    {
      "created_at": "2023-04-11T07:33:48.297784+00:00",
      "updated_at": "2023-04-11T08:51:42.362117+00:00",
      "metadata": {
        "username": "user16",
        "domain": "user16.com",
        "website": "/wordpress"
      },
      "advice": {
        "id": 23485,
        "type": "SITE_OPTIMIZATION",
        "status": "applied",
        "description": "Turn on AccelerateWP feature",
        "is_premium": false,
        "module_name": "accelerate_wp",
        "total_stages": 0,
        "completed_stages": 0,
        "detailed_description": "To improve site performance, enable the AccelerateWP optimization feature. We recommend applying the advice if you see it frequently for the most valuable URLs of your site."
      }
    }
  ],
  "result": "success",
  "timestamp": 1681203110
}
End-user X-Ray plugin
Please refer to the CloudLinux OS Solo user documentation.
X-Ray client
X-Ray client is a PHP extension named xray.so. It analyzes the processing time of the entire request and its parts and then sends the data to the X-Ray agent.
List of supported PHP versions
The list of currently supported PHP versions:
| ALT PHP: | EA PHP: | Plesk PHP | DirectAdmin PHP | Other panels PHP |
|
|
|
|
|
Functions that X-Ray client can hook
Database queries
- Functions from the MySQL extension:
mysql_querymysql_db_querymysql_unbuffered_query
- Functions from the MySQLi extension:
mysqli_querymysqli::querymysqli_multi_querymysqli::multi_querymysqli_real_querymysqli::real_query
- Functions from the PDO extension:
PDO::execPDO::queryPDOStatement::execute
External requests
- Function curl_exec
System PHP functions
It may be any PHP system function which can be related to a PHP engine or other PHP extension, for example fopen() or json_encode(). A list of these functions can be found here.
Configuration Options
xray.enabled
Syntax: xray.enabled=On/Off
Default: On
Changeable: PHP_INI_SYSTEM
Description: Enable or disable X-Ray extension from php.ini
xray.database_queries
Syntax: xray.database_queries=[number]
Default: 20
Changeable: PHP_INI_SYSTEM
Description: The number of the slowest SQL queries which will be sent to the X-Ray agent. The min value is 0 and the max value is 100. If the variable value is more, the default value will be used.
xray.external_requests
Syntax: xray.external_requests=[number]
Default: 20
Changeable: PHP_INI_SYSTEM
Description: The number of the slowest external requests (the curl_exec function) which will be sent to the X-Ray agent. The min value is 0 and the max value is 100. If the variable value is more, the default value will be used.
xray.system_functions
Syntax: xray.system_functions=[number]
Default: 20
Changeable: PHP_INI_SYSTEM
Description: The number of the slowest system functions which will be sent to the X-Ray agent. The min value is 0 and the max value is 100. If the variable value is more, the default value will be used.
xray.backtrace_depth
Syntax: xray.backtrace_depth=[number]
Default: 10
Changeable: PHP_INI_SYSTEM
Description: The backtrace depth to the main() function which will be sent to the X-Ray agent. The min value is 0 and the max value is 20. If the variable value is more, the default value will be used.
xray.processor
Syntax: xray.processor=[processor_name]
Default: xray
Changeable: PHP_INI_SYSTEM
Description: Tells the X-Ray client which processor to use. The new processors may be added in the future. The default processor is xray which means to send data to the X-Ray agent.
xray.tasks
Syntax: xray.tasks=host:uri:ip:id
Default: no value
Changeable: PHP_INI_SYSTEM
Description: The current tracing tasks for the given PHP request. This directive is added automatically by the X-Ray manager when creating a task. It is not allowed to edit manually, as X-Ray may stop working.
xray.to_file
Syntax: xray.to_file=On/Off
Default: Off
Changeable: PHP_INI_SYSTEM
Description: Only for debug purposes. Writes to a file data which is sent to the processor.
xray.debug
Syntax: xray.debug=On/Off
Default: Off
Changeable: PHP_INI_SYSTEM
Description: Only for debug purposes. Enables debug output during request processing. In the On mode can slow down the domain.
xray.debug_file
Syntax: xray.debug_file=[path_to_file]
Default: /tmp/xray-debug.log
Changeable: PHP_INI_SYSTEM
Description: Only for debug purposes. Specifies a file for logging debug information.
X-Ray agent
This is a service that receives data from the X-Ray client and sends it to the remote storage.
Managing X-Ray service
The X-Ray agent is managed by the service utility.
To start the X-Ray agent, run the following command:
service xray-agent startTo stop the X-Ray agent, run the following command:
service xray-agent stopTo restart the X-Ray agent, run the following command:
service xray-agent restart
FAQ
Does X-Ray affect website performance?
X-Ray affects website performance. Our tests show 5-10 % overhead from a website loading time with X-Ray tracing enabled. X-Ray allows you to find website performance issues and should not be enabled permanently. If your website is very slow, you can enable X-Ray to find the cause and then disable it.
My customers override php versions in different folders and X-Ray does not trace those websites, what should I do?
You should turn on the X-Ray serverwide mode or the X-Ray phpinfo mode.
What should I do if I see the warning "Task is duplicated by URL"?
This warning means that you already have a task to trace this URL in the list of your tracing tasks. If you see this warning, a new task can be created only with the On hold status and you will be able to run it only when the previous task with the same URL will be completed.
Note that the URL field supports wildcard matching and you can have a case when X-Ray is tracing the URL=domain.com/* and you are trying to create a new task with URL=domain.com/xray.php. In this case, you will see that warning because the * URLs array includes xray.php.
I started a tracing task and made requests to URL but did not see any results in the UI. What should I do?
Check that xray extension is enabled for the domain. To do so, go to the
phpinfo()page and make a request. In the phpinfo output try to find the following section: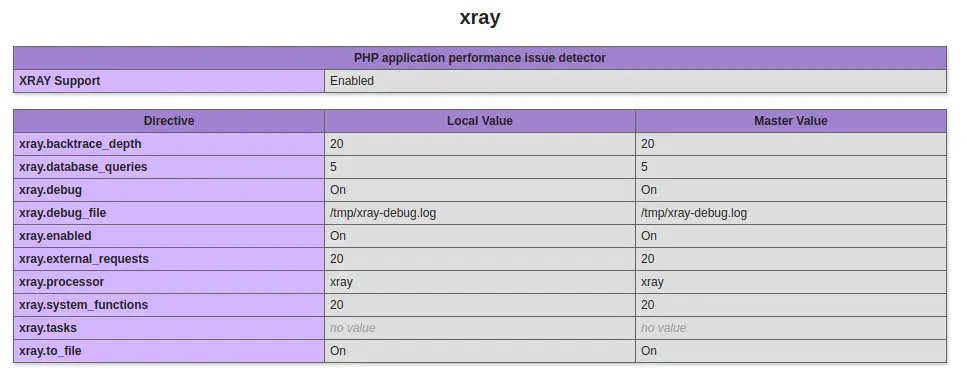
If you cannot see that section, try to restart PHP processes for that user (the simplest way is to restart Apache) and check that you can see the xray extension.
If you can see the xray extension in the phpinfo, check that X-Ray agent service is running with the service xray-agent status command. If it is not running, start it with the
service xray-agent startcommand.X-Ray may not send data if a site uses a caching plugin, as the caching plugin is outputting HTML, thus there are no PHP scripts to examine. We encountered such issues with sites that use LSCache and WP Super Cache plugins. Check that your site does not use caching plugins. If so, disable it while tracing a site to get information from X-Ray.
If you set a client’s IP when creating the tracing task, check that your requests come to the server with this IP via phpinfo (since there may be NAT between your local machine and the server).

If, after checking the previous items, the issue persists, contact our support team.
What to do if X-Ray is not found in the phpinfo() page?
If you managed to create a tracing task, this means that the xray.ini file was created in a system. Therefore, there may be two reasons why it did not appear in the phpinfo page of the domain.
PHP process wasn't reloaded after adding the xray.ini. To solve this, you should restart the Apache or fpm service for the domain on which the tracing was started. At the moment, this is done automatically by the X-Ray manager after creating the task.
Your domain uses a PHP version different from the one which was detected by the X-Ray manager. To solve this, check the scan dir for additional ini files for your domain.

Then check the
ini_locationthat was passed to the X-Ray manager by running the following command:cat /usr/share/alt-php-xray/manager.log | grep ini_locationFind your tracing task in the output and check that the
xray.iniexists in this directory, also check that theinipath is the same in the phpinfo page output and in theini_locationdirective for your tracing task. If they are the same, you should reload your PHP. If they are different that means that the X-Ray manager could not correctly determine the PHP version your domain uses. In this case, contact our support team at https://cloudlinux.zendesk.com/hc/requests/new.
I use LiteSpeed, X-Ray is enabled and it is shown in the phpinfo() page but does not collect data when sending requests to a site. What to do?
Check for the CacheLookup on option in the htaccess file for your domain. If the option is there, LiteSpeed processes requests bypassing the PHP X-Ray extension. In this case, to get tracing information, you should remove the CacheLookup on option.
What is the proper format for the URL?
All of the examples below are correct:
http://domain.comhttp://domain.com/https://domain.comhttps://domain.com/
You can use any of them with a prefix www. and it is also correct.
AccelerateWP
Get started
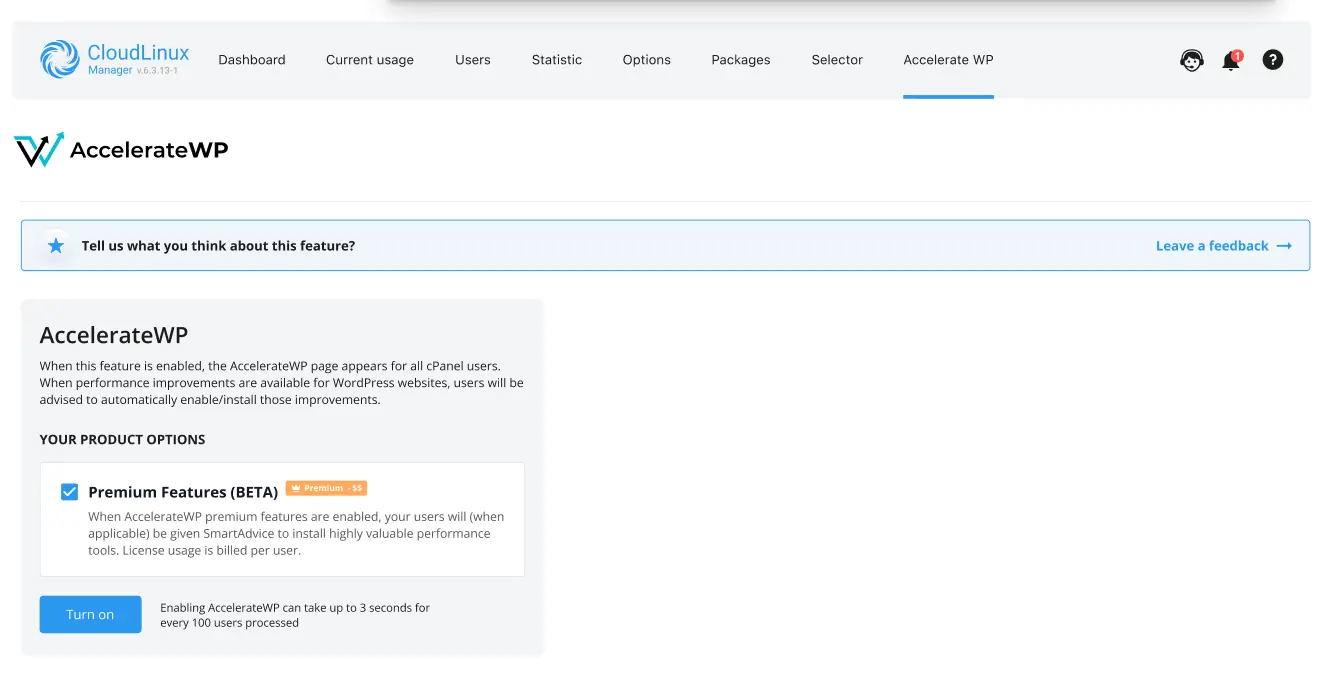
AccelerateWP carries a suite of optimization features that can be enabled and automatically configured for the end-user's site.
There are AccelerateWP and AccelerateWP Premium feature suites.
AccelerateWP suite is always enabled when AccelerateWP is turned on. Choose whether you want to offer AccelerateWP Premium for your users and click "Turn on" to start exploring AccelerateWP.
Once the AccelerateWP suite is enabled by administrator, end-users will see an AccelerateWP tab in their cPanel interface and be able to activate the optimization feature.
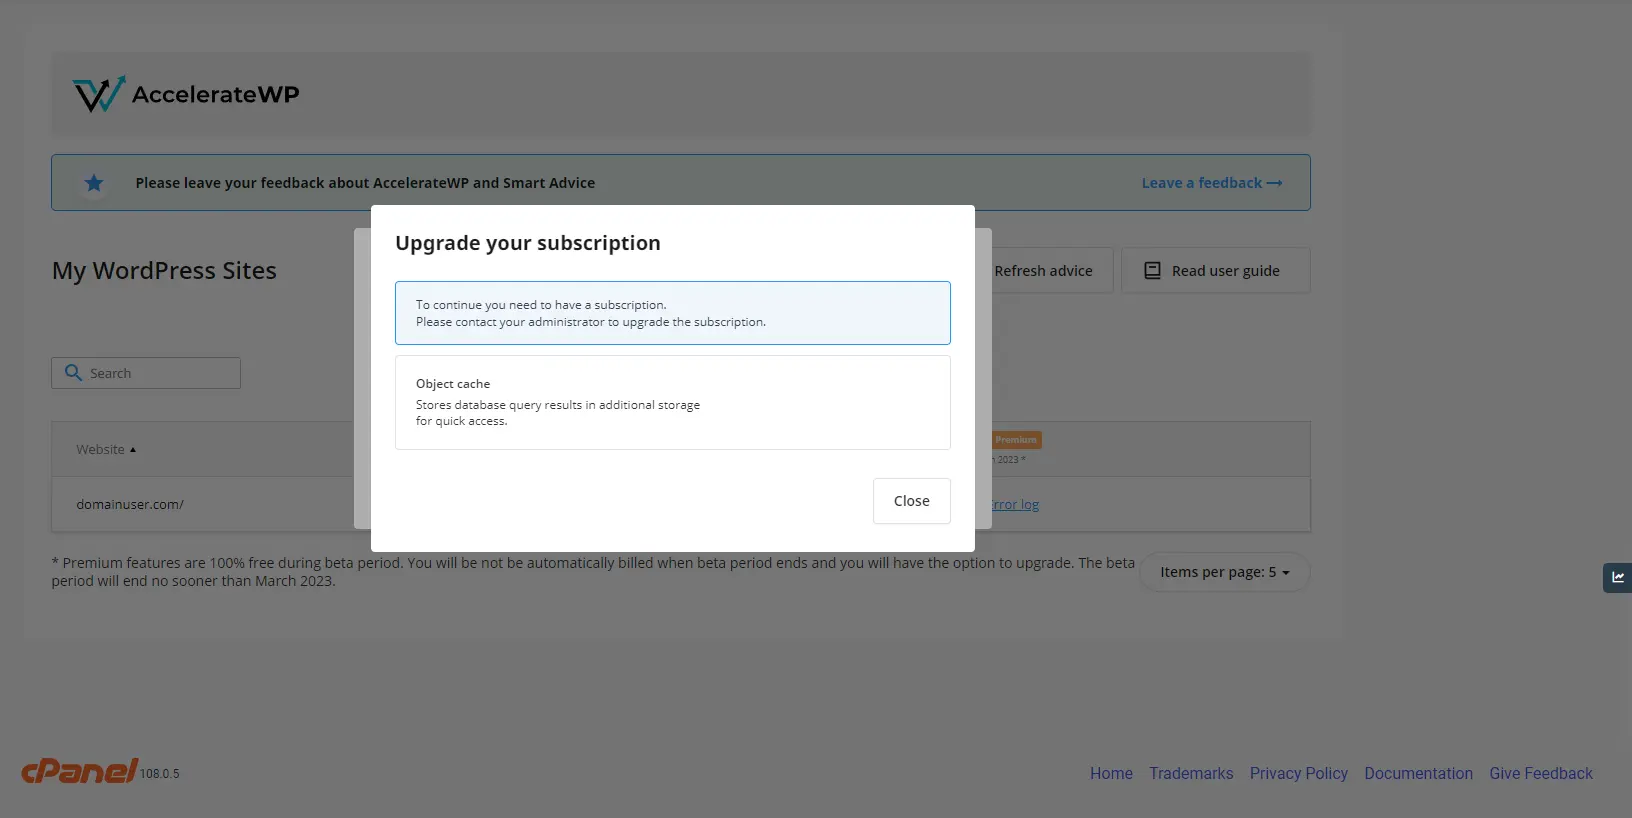
When AccelerateWP Premium suite enabled by administrator, end-users will see the Object Caching feature in their interface, but cannot install the plugin unless they purchase the feature using WHMCS or 3'd party billing.
AccelerateWP suite
This is a basic suite which includes AccelerateWP base feature: a WordPress optimization plugin that provides full page caching, GZIP compression and some other useful optimizations.
AccelerateWP suite limitations
- the website must be served with Apache or LiteSpeed web server;
- the website must use PHP version 7.3 or higher.
- the WordPress version must be 5.8 and higher.
- the other WordPress Caching plugins must not be installed.
- the WordPress should not run in Multisite mode.
Note
Some AccelerateWP functions depend on external services. For the functions to work properly, the following URLs and IPs need to be allowed at all security levels:
- https://awp-saas.cloudlinux.com
- 213.239.192.204
AccelerateWP Premium suite
Attention
This feature is free of charge only during the beta testing period. Afterwards it will be charged. Beta testing period ends no earlier than March 2023.
This is a premium suite which includes Object Caching feature.
The Object Caching mechanism stores database query results in additional storage for quick access. This mechanism is really helpful in case if website needs to process multiple pages per second as requests come in and may be helpful in case when full page caching cannot be used, e.g. on personalized pages.
Premium suite limitations
- the website must be served with Apache web server;
- the website must use one of the following PHP handlers:
- the website must use ea-PHP version 7.4 or 8.0.
- the WordPress version must be 3.7 and higher.
- the other WordPress Caching plugins must not be installed.
- the Snuffleupagus must be turned off.
- the WordPress should not run in Multisite mode.
Limitations
There are the following requirements to use AccelerateWP:
- the server must have CloudLinux Shared PRO license;
- the server must be powered with cPanel.
Administrator interface
Overview
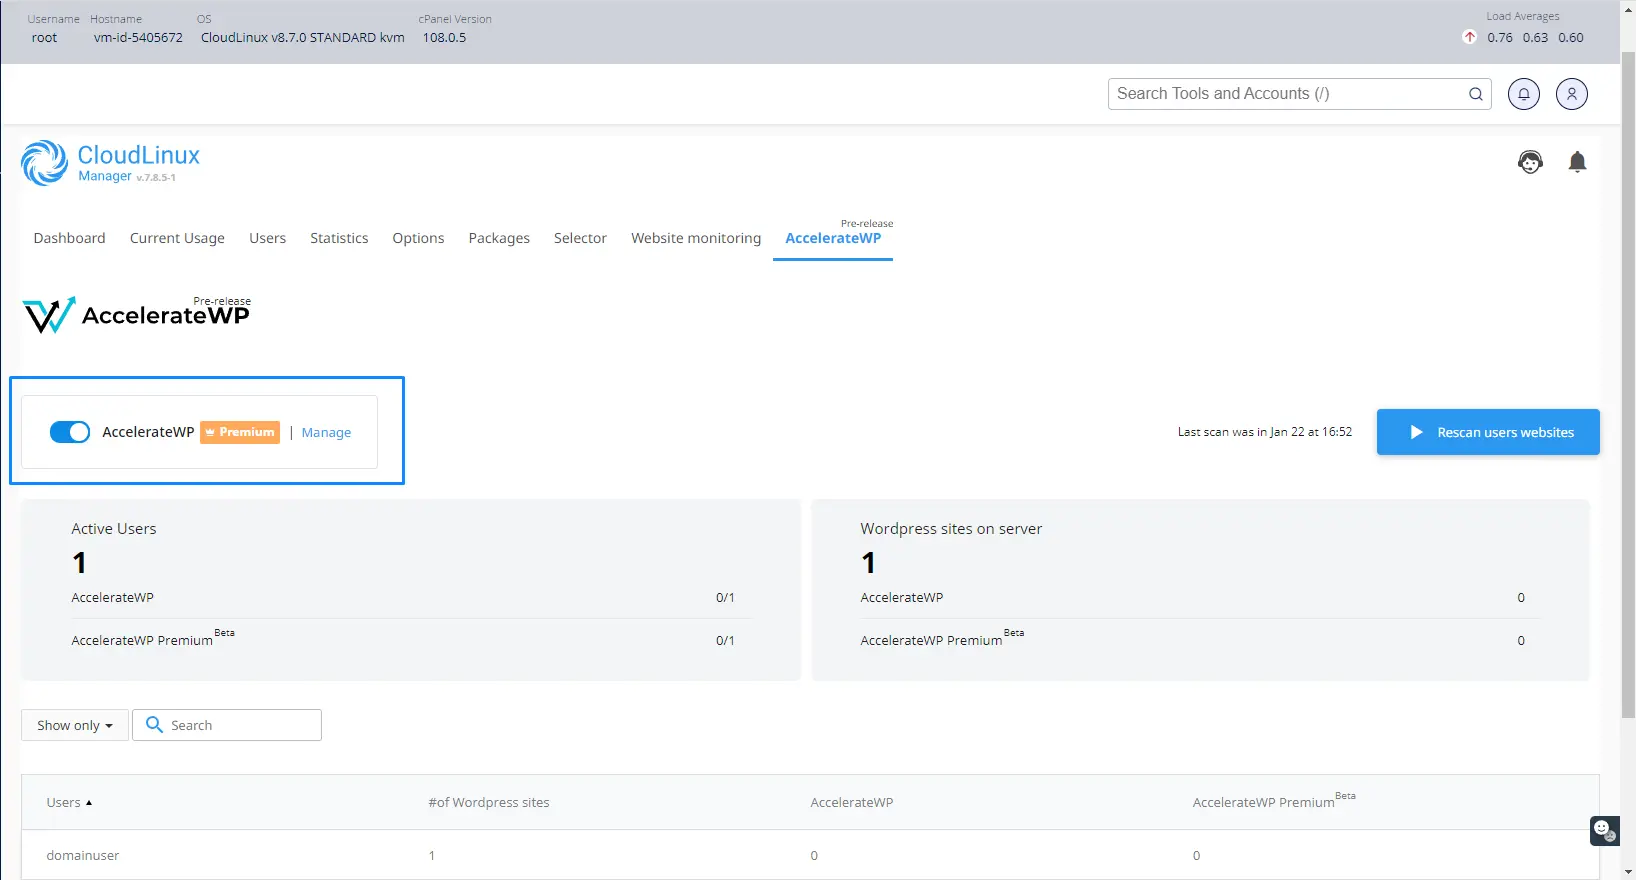
In the CloudLinux Manager → AccelerateWP tab Administrator has the opportunity to provide end-user with suites of features, which on its turn could be activated by end-user. To provide best experience, activate free features for all WordPress sites.
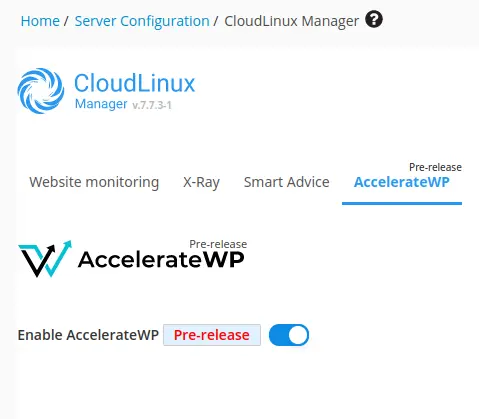
By toggling the Enable AccelerateWP for all users an administrator provides end-users with AccelerateWP feature. Once the feature suite is enabled by administrator, end-users will see an AccelerateWP tab in their cPanel interface and be able to activate the optimization feature.
Suites usage statistics
When AccelerateWP is enabled, the AccelerateWP usage statistics is shown.
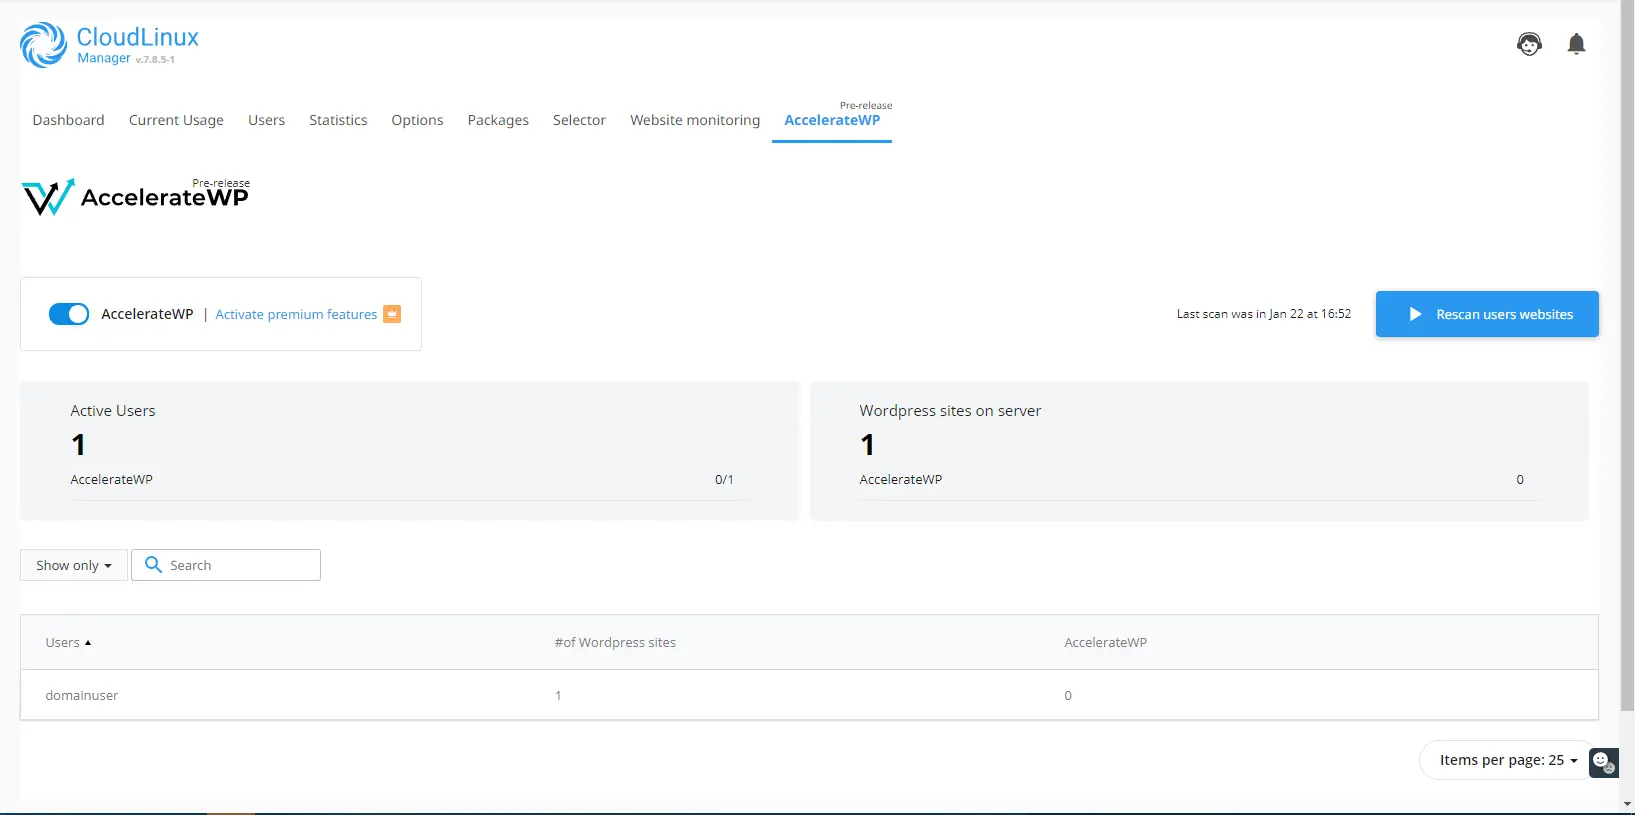
It includes:
Active Usersblock with total number of users and number of users who has activated the optimization feature/total usersWordpress sites on serverblock with total number of WordPress sites and WordPress sites optimized by the feature- statistics table
Each row in the statistics table represents a particular user.
The first column #of Wordpress sites shows total number of user's WordPress sites.
The second column AccelerateWP shows number of user's WordPress sites, optimized by the feature.
In case if both AccelerateWP and AccelerateWP Premium feature suites are enabled, the statistics is extended with AccelerateWP Premium metrics.
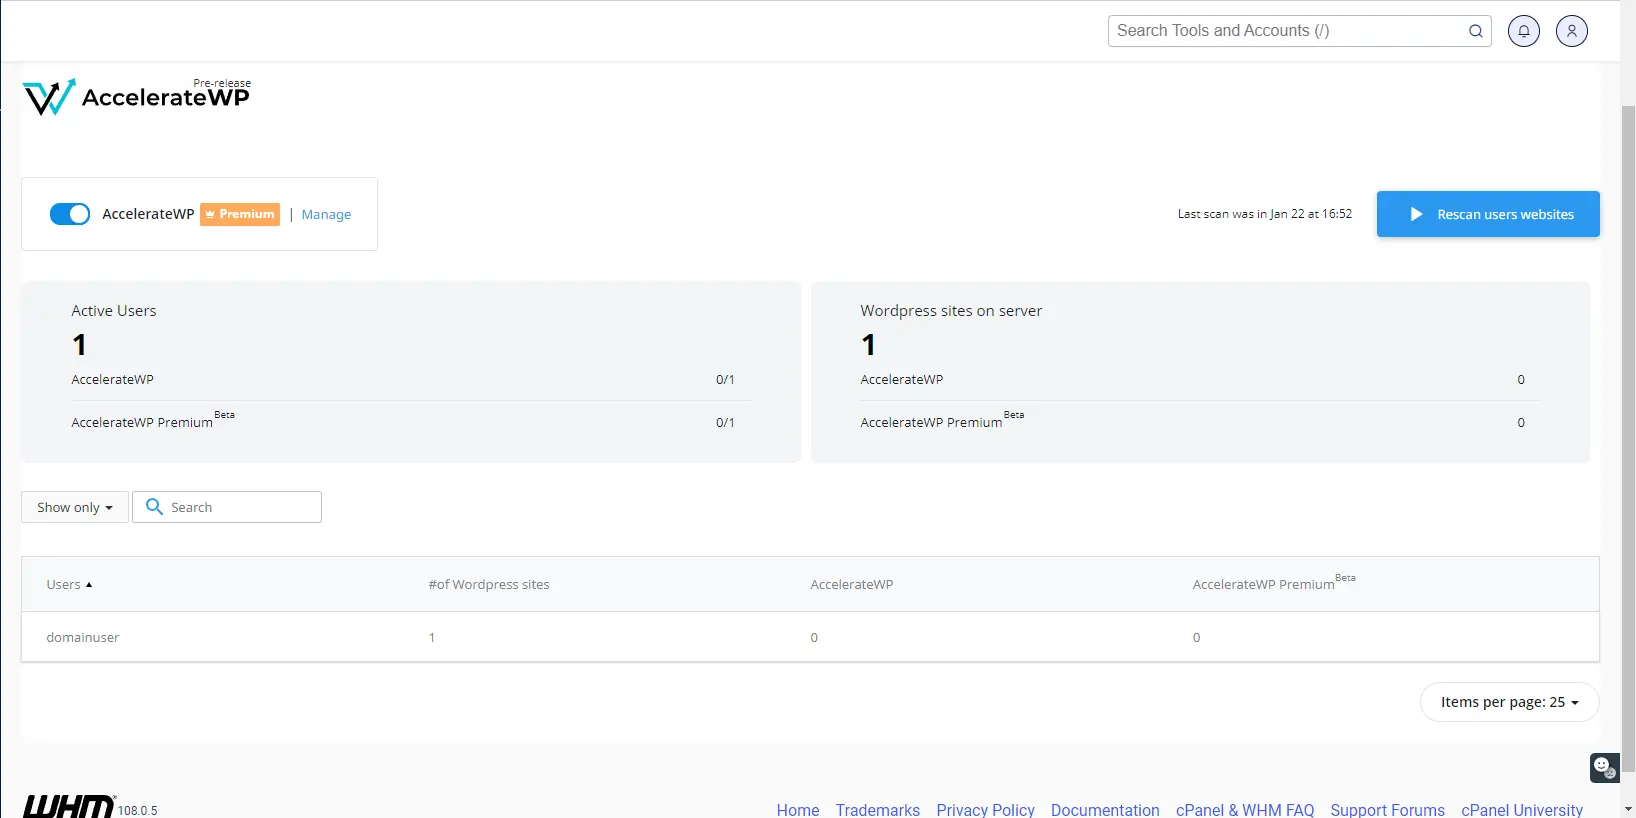
Please notice the AccelerateWP Premium rows in the Active Users and the Wordpress sites on server blocks, and also the AccelerateWP Premium column in statistics table.
Note
Newly created users will be accounted for 10 min after adding. If you want to get updated statistics immediately, use the "Rescan users websites" button.
Filters
You may use the following filters to browse AccelerateWP statistics slices.
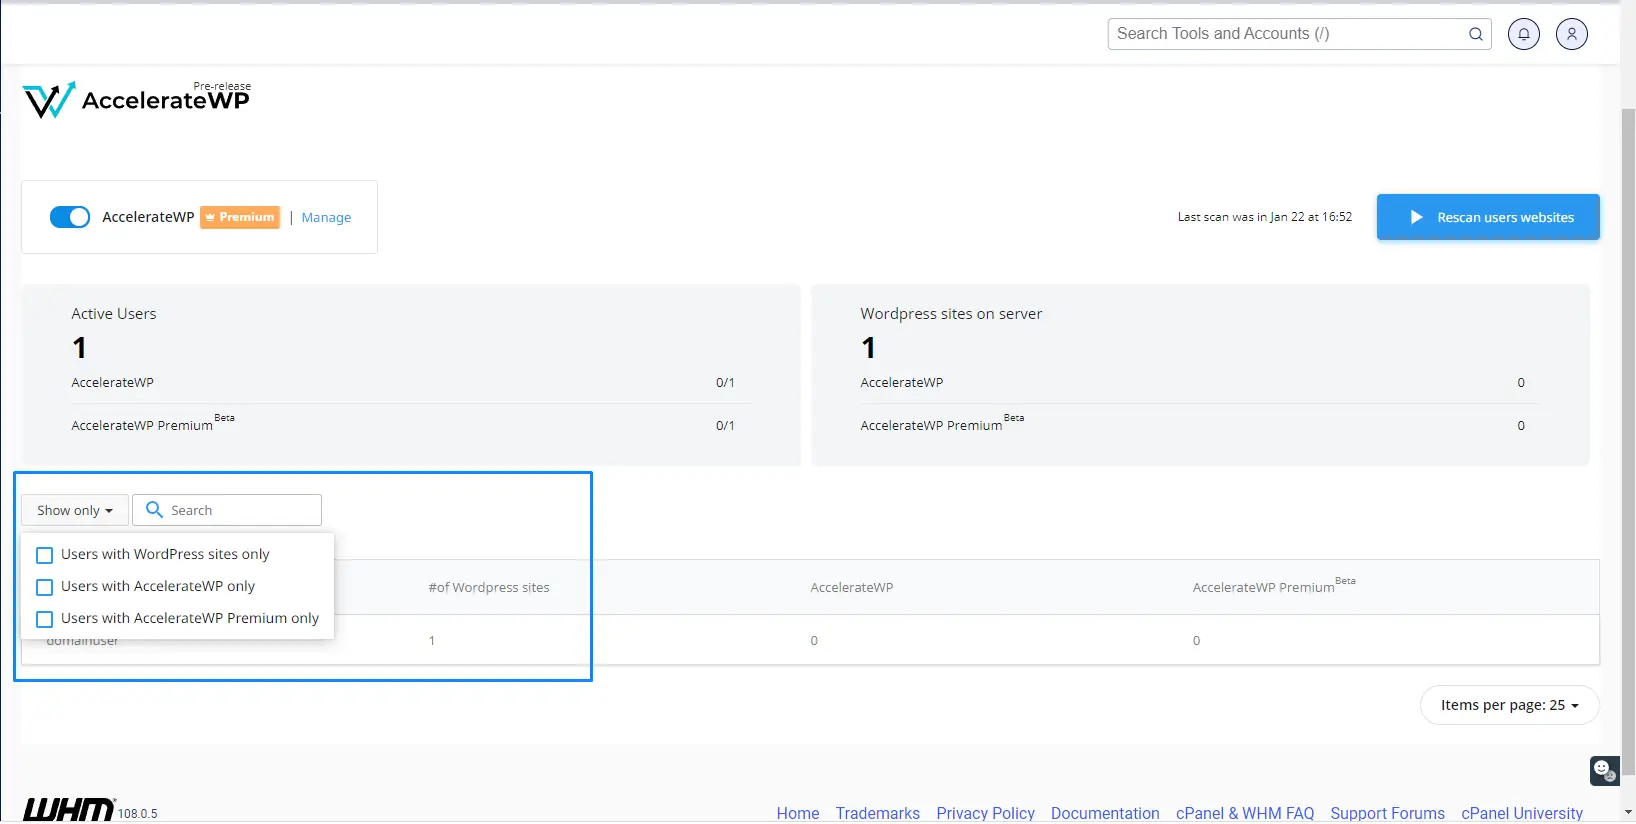
Users with WordPress sites onlyfilter will show statistics for users which already have WordPress sites; users without WordPress installations will be hiddenUsers with AccelerateWP onlyfilter will show statistics for users who utilizes the AccelerateWP optimization feature; users who did not activated AccelerateWP feature will be hiddenUsers with AccelerateWP Premium onlyfilter will show statistics for users who utilizes AccelerateWP Premium (Object Caching) feature; users who did not activated AccelerateWP Premium feature will be hidden
Activate free AccelerateWP for all WordPress sites on the server
Use the cloudlinux-awp-admin enable-feature CLI command to ensure the best performance for every WordPress site. CLI command scans a server for all WP sites and activates the AccelerateWP feature suite. It can take up to 2 minutes for a single site. CLI command skips activation for WordPress sites with page caching or feature incompatibilities.
Scan the server in background mode and activate AccelerateWP on those WordPress sites where it is possible:
cloudlinux-awp-admin enable-feature --all
The output will denote the progress state of the process.
Check activation status:
cloudlinux-awp-admin enable-feature --status
The output will be either:
- Activation is still in progress,
- Activation is done. The message will state how many users were initially for the scan, a number of WordPress sites with successfully activated suite, and the total number of WordPress sites scanned.
Disable AccelerateWP for a particular user
Use CLI commands to disable undesired optimization suites for a single user.
To disable AccelerateWP suite:
cloudlinux-awp-admin set-suite --suites=accelerate_wp --disallowed --users=<username>
To disable AccelerateWP Premium suite:
cloudlinux-awp-admin set-suite --suites=accelerate_wp_premium --disallowed --users=<username>
To disable both suites:
cloudlinux-awp-admin set-suite --suites=accelerate_wp,accelerate_wp_premium --disallowed --users=<username>
Useful AccelerateWP CLI commands
Use CLI commands to check AccelerateWP features status.
If you are also interested in Smart Advice CLI command, they could be found here.
Warning!
This is an experimental feature. The backwards compatibility is not guaranteed.
AccelerateWP suites statistics
Get suites statistics:
cloudlinux-awp-admin get-report --all
This CLI command returns the following information:
suitesvisibility status- possible values for visibility status are:
visible,allowed,disabled
- possible values for visibility status are:
The example output is given below:
{
    "result": "success",
    "suites": {
        "accelerate_wp": {
            "source": "default",
            "status": "allowed"
        },
        "accelerate_wp_premium": {
            "source": "default",
            "status": "visible"
        }
    },
    "timestamp": 1681216482.2929366
}
AccelerateWP features statistics
Get overall AccelerateWP features usage statistics for a server with:
cloudlinux-awp-admin get-stat
This CLI command returns the following information:
- number of
allowed_usersintotaland per feature - number of sites with enabled features in
totaland per feature --enabled_sites - number of users with visible features in
totaland per feature --visible_users - features which are currently allowed --
features_allowed_by_default - features which are currently visible --
features_visible_by_default
The example output is given below:
{
    "allowed_users": {
        "object_cache": 0,
        "site_optimization": 1,
        "total": 1
    },
    "enabled_sites": {
        "object_cache": 0,
        "site_optimization": 1,
        "total": 1
    },
    "features_allowed_by_default": [
        "site_optimization"
    ],
    "features_visible_by_default": [
        "object_cache",
        "site_optimization"
    ],
    "is_accelerate_wp_flag_enabled": false,
    "is_accelerate_wp_icon_enabled": true,
    "result": "success",
    "timestamp": 1681208259.19426,
    "visible_users": {
        "object_cache": 1,
        "site_optimization": 1,
        "total": 1
    }
}
AccelerateWP features detailed statistics
AccelerateWP features detailed statistics is available in user's environment only.
Use the following CLI command on behalf of a user:
cloudlinux-awp-user get
The command reports:
- features allowed for a user --
allowed_features - all user's websites
docrootswith features information per eachwps, which includes:- status of each feature -- if the feature is
enabled, if the feature isvisible - issues detected (if any) for each feature
- status of each feature -- if the feature is
- subscription status (for premium features) --
subscription - features visible for a user --
visible_features
The example output is given below:
{
    "allowed_features": {
        "accelerate_wp": [],
        "accelerate_wp_premium": []
    },
    "docroots": [
        {
            "domains": [
                "user0.com"
            ],
            "php_handler": "fastcgi",
            "php_version": "plesk-php73-fastcgi",
            "wps": [
                {
                    "features": {
                        "accelerate_wp": {
                            "enabled": false,
                            "issues": [
                                {
                                    "context": {
                                        "plugins": "WP Rocket"
                                    },
                                    "description": "Found conflicting plugins: %(plugins)s.",
                                    "fix_tip": "Deactivate and uninstall the conflicting plugin using the WordPress administration interface.",
                                    "header": "Conflicting plugins are enabled",
                                    "type": "incompatibility"
                                }
                            ],
                            "visible": true
                        },
                        "object_cache": {
                            "enabled": false,
                            "issues": [
                                {
                                    "context": {
                                        "blog_url": "https://blog.cloudlinux.com/",
                                        "supported_handlers": "php-fpm, lsapi"
                                    },
                                    "description": "Website uses unsupported PHP handler. Currently supported handler(s): %(supported_handlers)s.",
                                    "fix_tip": "Please, set or ask your system administrator to set one of the supported PHP handlers for the domain: %(supported_handlers)s. Or keep watching our blog: %(blog_url)s for supported handlers list updates.",
                                    "header": "Unsupported PHP handler",
                                    "type": "incompatibility"
                                }
                            ],
                            "visible": true
                        }
                    },
                    "path": "wordpress",
                    "version": "6.2"
                }
            ]
        },
        {
            "domains": [
                "sub.user0.com"
            ],
            "php_handler": "fastcgi",
            "php_version": "plesk-php73-fastcgi",
            "wps": []
        }
    ],
    "max_cache_memory": "64mb",
    "result": "success",
    "subscription": {
        "object_cache": "no"
    },
    "timestamp": 1681200081.765476,
    "upgrade_url": null,
    "used_memory": null,
    "visible_features": {
        "accelerate_wp": [
            "accelerate_wp"
        ],
        "accelerate_wp_premium": [
            "object_cache"
        ]
    }
}
AccelerateWP disable Redis Object Cache Pro banner
Depending on the server settings, the WP_REDIS_DISABLE_BANNERS constant will be defined in the wp-config.php file when the module is activated, which affects the display of promotional materials.
To change the display of promotional materials for all new installations of the Redis Object Cache module by default, you need to set the settings:
To display (by default):cloudlinux-awp-admin set-options --enable-object-cache-banners
To hide:cloudlinux-awp-admin set-options --disable-object-cache-banners
To change the WP_REDIS_DISABLE_BANNERS constant for previously installed modules, you need to run a process to update the constant:
Hide on websites where the module is installed
- for all websites:
cloudlinux-awp-admin object-cache-banner --all --disable
orcloudlinux-awp-user object-cache-banner --all --disable - for a specific website:
cloudlinux-awp-user object-cache-banner --wp-path "/" --domain "demo.com" --disable
Display on websites where the module is installed
- for all websites:
cloudlinux-awp-admin object-cache-banner --all --enable
orcloudlinux-awp-user object-cache-banner --all --enable - for a specific website:
cloudlinux-awp-user object-cache-banner --wp-path "/" --domain "demo.com" --enable
If the banner was previously disabled/enabled for the website, then for its subsequent activation of the ObjectCache module, the general settings at the server level will be applied. This means that for each website we do not store an individual banner disable/enable setting.
WHMCS billing
CloudLinux developed it's own WHMCS plugin which provides you AccelerateWP billing integration out of the box. Check out the documentation to find how to install and use the plugin.
Other billing integration
As AccelerateWP Premium is the feature that works on subscription basis, we made it possible for hosters to integrate their existing billing systems with our plugin and sell the feature for their users.
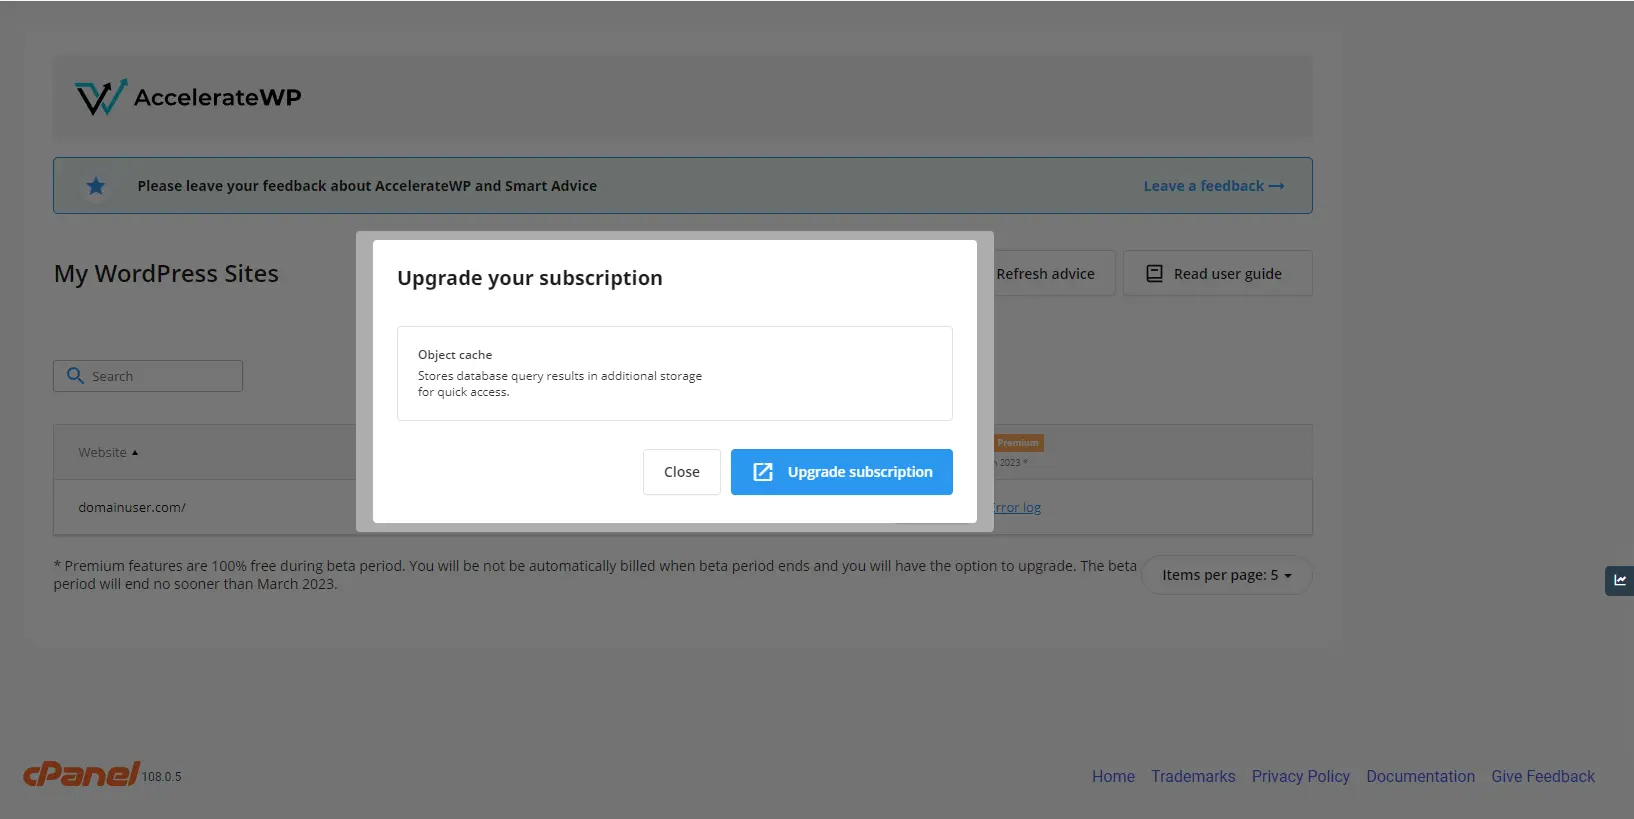
When AccelerateWP Premium is enabled in admin interface, users get proposal to upgrade their subscription.
When user upgrades the subscription to the plan with AccelerateWP support, billing must execute the following command on the server:
cloudlinux-awp-admin set-suite --suites=accelerate_wp_premium --allowed --source=BILLING_OVERRIDE --users=<username>
This command makes two things:
- allow user to install plugin, bypassing the upgrade window;
- reports premium as being used to CLN, starting the billing cycle for hoster.
When user terminates or downgrades plan, the following command must be executed by the billing system:
cloudlinux-awp-admin set-suite --suites=accelerate_wp_premium --default --source=BILLING_OVERRIDE --users=<username>
Setup upgrade URL for AccelerateWP Premium
The upgrade window can be customized with link to the plan upgrade page, which can be set using CLI command:
cloudlinux-awp-admin set-options --upgrade-url https://plan.upgrade/splash
AccelerateWP automatically appends GET parameters when the link is displayed.
https://plan.upgrade/splash/?m=acceleratewp&action=provisioning&username=democom&domain=demo.com&server_ip=10.51.0.10
| Parameter | Value | Description |
|---|---|---|
| m | acceleratewp | Constant. |
| action | provisioning | Constant. |
| username | democom | Customer's account name. |
| domain | demo.com | Customer's account primary domain. |
| server_ip | 10.51.0.10 | Primary IP of the server where AccelerateWP is installed |
Parameters can be used to determine the billing account of the user in order to display proper page. WHMCS plugin already has automatic redirect to upgrade page, there is only needed to set upgrade-url to the root of your WHMCS instance.
cloudlinux-awp-admin set-options --upgrade-url https://whmcs.mydomain.zone/
Upgrade URL is opened in modal browser window and will be automatically closed when AccelerateWP receives callback about successful upgrade.
Callback is already implemented in WHMCS plugin, but if you are using some other billing, you should add the following code on the page which appears when user successfully upgrades subscription.
<script>
if(window.opener && !window.opener.closed) {
    window.opener.postMessage('PAYMENT_SUCCESS', '*');
}
</script>
In order to remove the link, just set upgrade url to the empty one.
cloudlinux-awp-admin set-options --upgrade-url ''
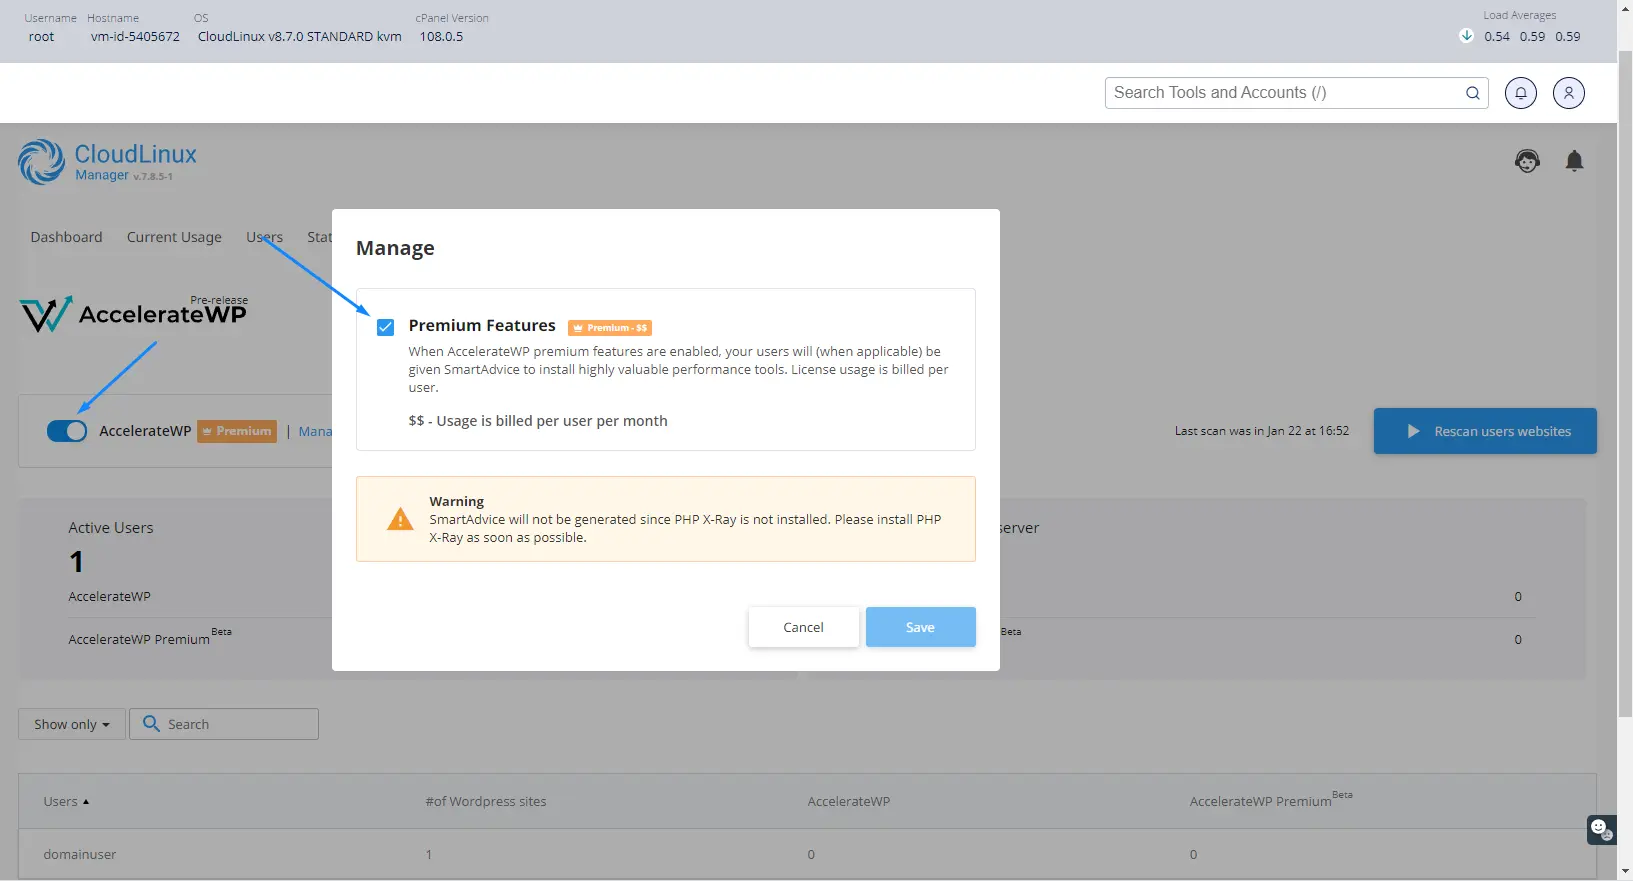
Disable AccelerateWP Premium
If you would like to stop using AccelerateWP Premium, click on the manage link and remove Premium Features checkbox. AccelerateWP will be still available for your users.
Disable AccelerateWP
If you would like to stop using AccelerateWP completely, toggle the AccelerateWP back. Both AccelerateWP and AccelerateWP Premium will be turned off.
This operation will:
- disable AccelerateWP tab in users' control panel interface
- disable all AccelerateWP optimization suites
- deactivate all optimization features for all users
This operation will NOT:
- cancel the subscription made by user in WHMCS or other billing. User's subscription stays alive and user will still be charged in billing system unless hoster manually makes a refund
Logs
The main AccelerateWP log is located at
/var/log/clwpos/main.log
In case if AccelerateWP Premium is active, the auxiliary monitoring daemon clwpos_monitoring is also activated. Its log is located at
/var/log/clwpos/daemon.log
FAQ
With which panel can I use AccelerateWP?
Currently AccelerateWP is compatible with cPanel, Plesk, and DirectAdmin only.
Is it possible to use AccelerateWP on a non-control panel server?
Yes, if a custom integration mechanism is used: custom control panel integration.
Do you plan to enable support of Nginx server?
This is a part of our very long term plans, thus not expected in the nearest future.
How will it help my customers?
AccelerateWP is a complex solution to help your customers increase their WordPress site performance. AccelerateWP brings number of optimization features, like object caching, css and js preprocessing and website preloading.
How could I monitor Redis instances while using AccelerateWP Premium suite?
Redis process is started for a user after activating AccelerateWP Premium Object Caching feature for at least one Wordpress site. It is killed after AccelerateWP Premium Object Caching has been deactivated for all user's websites.
Look through the processes list to check Redis status for a particular user:
 ps aux | grep redis

 awpuser  2662517  0.0  0.5 101096  8512 ?        Sl   15:33   0:00 /opt/alt/redis/bin/redis-server unixsocket:/home/awpuser/.clwpos/redis.sock
In case if AccelerateWP Premium is active, the auxiliary monitoring daemon clwpos_monitoring is also activated. It checks Redis instances each 5 minutes, starts new instances, restart failed ones and kills the “garbage” instances if needed. Check daemon status using service clwpos_monitoring status and its main log: /var/log/clwpos/daemon.log.
Troubleshooting
My users are complaining that their feature are not installed automatically after subscription upgrade
This can be caused by several reasons. Either your customer's website was detected to have malfunctions or there was an issue with environment when feature was installed (e.g. bad internet connectivity with wordpress market).
First, try to enable feature manually using AccelerateWP interface. Most likely you will find human-readable error message there.
Next, you can try to dive into /var/log/clwpos/daemon.log and find the reason why the enable command failed. Here is an example of successful feature installation for reference:
2023-02-14 11:01:14,696: (clwpos.daemon_base) [INFO] Running cloudlinux-awp-user enable --feature object_cache --domain wpujj.com --wp-path
2023-02-14 11:01:15,081: (clwpos.daemon_base) [INFO] Command succeded with output:
`CompletedProcess(args=['/bin/cagefs_enter.proxied', 'cloudlinux-awp-user', 'enable', '--feature', 'object_cache', '--domain', 'wpujj.com', '--wp-path', ''], returncode=0, stdout='{\n    "context": {\n        "domain": "wpujj.com",\n        "feature": "object_cache"\n    },\n    "result": "success",\n    "timestamp": 1676372475.044419,\n \n}\n', stderr='')`
2023-02-14 11:01:15,086: (clwpos.daemon_base) [INFO] background process finished: pid=415368
Also, some useful notes may be present in user's log located at /home/<username>/.clwpos/main.log.
If the issue persists, or you cannot resolve it yourself, contact CloudLinux support and attach /var/log/clwpos/daemon.log and /home/<username>/.clwpos/main.log for further investigation.
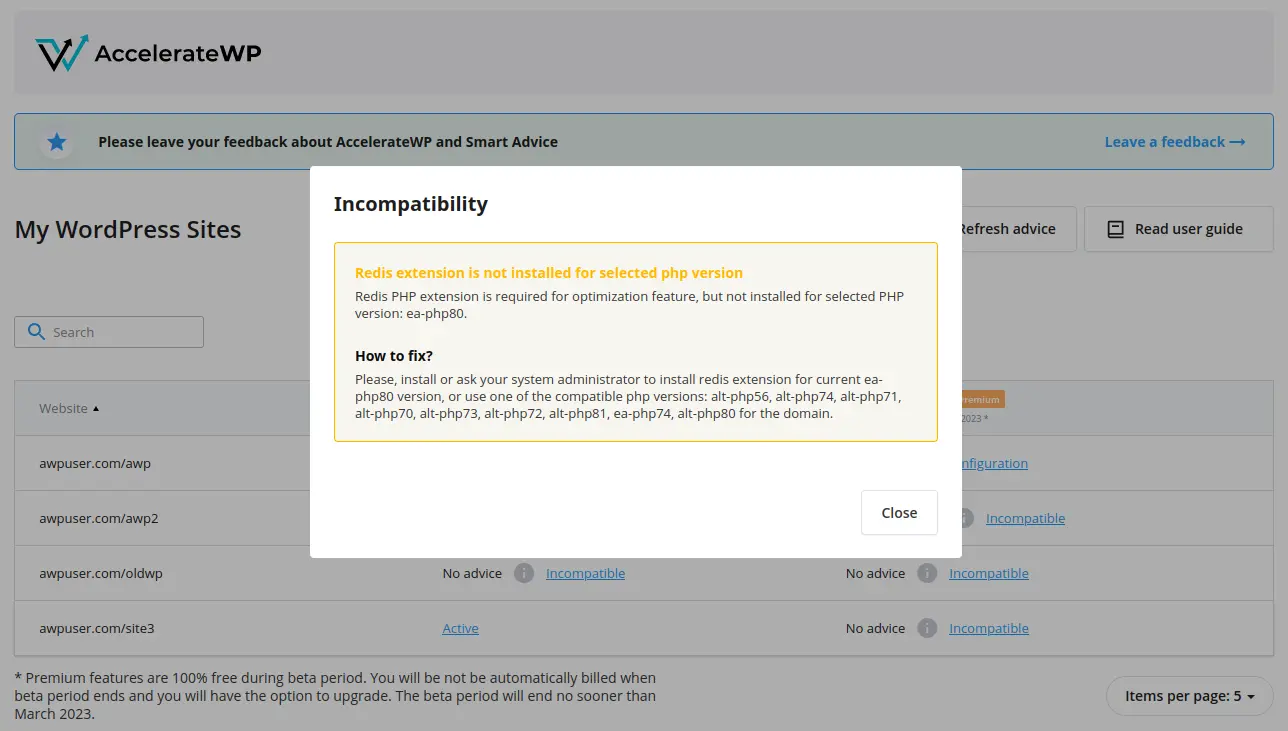
End-users of AccelerateWP Premium feature encounter Redis extension is not installed for selected php version
In order to make use of AccelerateWP Premium Object Caching feature, the loaded Redis extension is required for the end-user's website. End-users will not be able to activate the Object Caching feature until Redis extension configuration is incomplete.
Corresponding incompatibility warning will be displayed in control panel's User interface:
The Redis extensions are configured for all installed and supported PHP versions automatically:
- right after the AccelerateWP Premium suite is enabled
- by cron once a day
or you can trigger the utility manually:
/usr/sbin/enable_redis_for_panel_php
All errors will be displayed in standard output and logged into /var/log/clwpos/main.log.
Ensuring the EA-PHP Redis extension is configured correctly
Check Redis extension package is installed by running the following command
rpm -q ea-phpXY-php-redisInstall the corresponding extension if it is not present:
yum install ea-phpXY-php-redisConsider the example for checking out and installing Redis extension for
ea-php74:rpm -q ea-php74-php-redis yum install ea-php74-php-redisCheck Redis
inifile is present by running the following command:ls /opt/cpanel/ea-phpXY/root/etc/php.d/ | grep 50-redisConsider the example for checking out Redis extension for
ea-php74:ls /opt/cpanel/ea-php74/root/etc/php.d/ | grep 50-redisTry reinstalling the package if
inifile is missing.Make sure Redis module is loaded under specific user by running the following command:
su -c "php -m | grep redis" <username>
Ensuring the ALT-PHP Redis extension is configured correctly
Check if
redis.sois present for a particular alt-php version:ls /opt/alt/phpXY/usr/lib64/php/modules | grep redis.soConsider the example for checking alt-php74 redis.so:
ls /opt/alt/php74/usr/lib64/php/modules | grep redis.so
redis.so
If the Redis module is missing:
a. Install the
alt-phpXY-pecl-extpackage manually b. Run the Redis configuration script/usr/share/cloudlinux/wpos/enable_redis_for_alt_php.pyAll errors will be displayed in standard output and logged into
/var/log/clwpos/main.log.If the Redis module is present for a particular php version, but the incompatibility issue persists, re-check the following:
a. Make sure the Redis module is loaded under user:
su -c "php -m | grep redis" <username>b. Check the required extensions are enabled in
php.ini:cat /opt/alt/phpXY/etc/php.ini | grep redis.so cat /opt/alt/phpXY/etc/php.ini | grep json.so cat /opt/alt/phpXY/etc/php.ini | grep igbinary.soc. Enable missing extensions manually.
End-users of AccelerateWP encounter PHP-related issues during feature activation
End-users may encounter PHP-related errors while activating the AccelerateWP features.
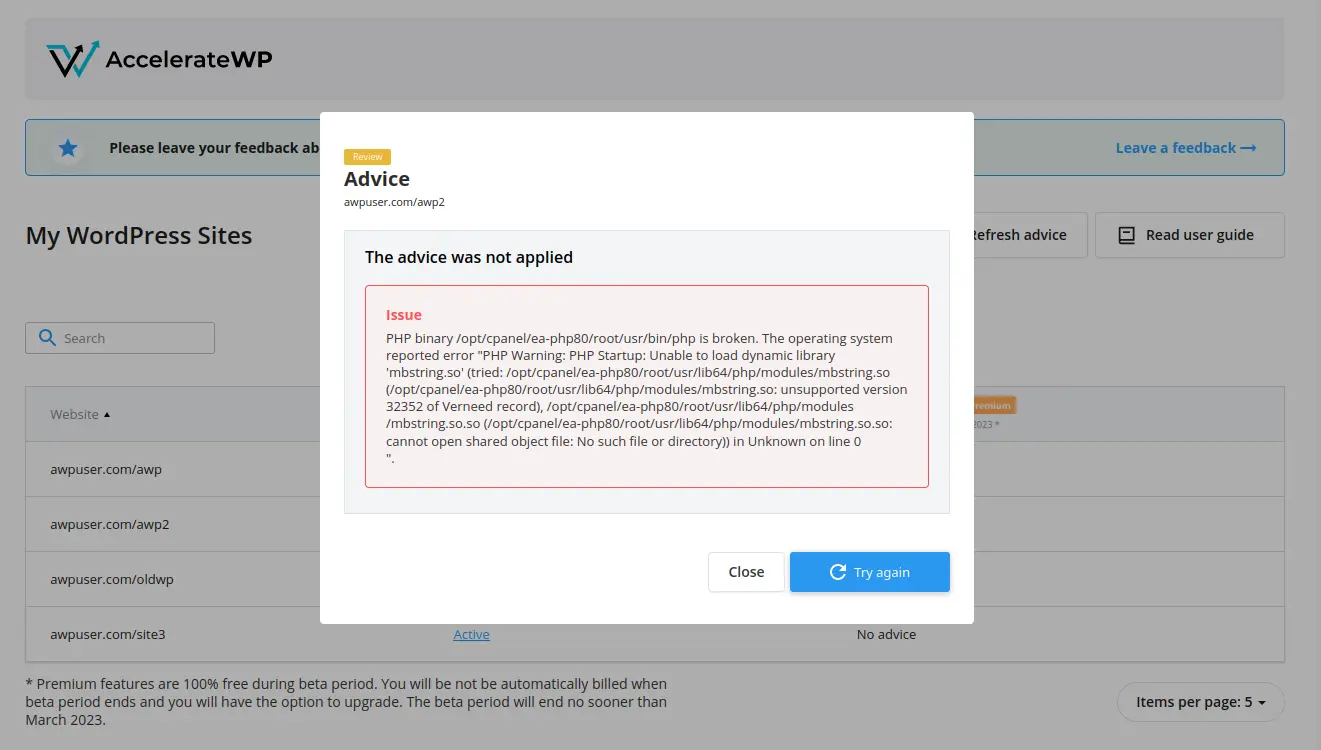
The general examples of possible reasons are:
- broken PHP binaries
- missing PHP files
- etc.
To check that this issue is caused by PHP itself, call any PHP command, example for cPanel:
/opt/cpanel/ea-php80/root/usr/bin/php -i
And make sure that installed ea-php80 packages are not broken using rpm -V <package_name>.
Reinstall broken packages if found.
Consider the example issue (presented at the picture above) with broken mbstring.so for ea-php80:
/opt/cpanel/ea-php80/root/usr/bin/php -i
Segmentation fault (core dumped)

rpm -V ea-php80

rpm -V ea-php80-php-mbstring
S.5....T.    /opt/cpanel/ea-php80/root/usr/lib64/php/modules/mbstring.so
......G..  a /usr/lib/.build-id/9c/38ed78a6d401ff6dce059ccea51c95870d98c5

yum reinstall ea-php80-php-mbstring
AccelerateWP for End-Users
Please find the AccelerateWP Suite End-User documentation here.
Limits
Cloudlinux Solo supports only inodes limits. More informormation is available here
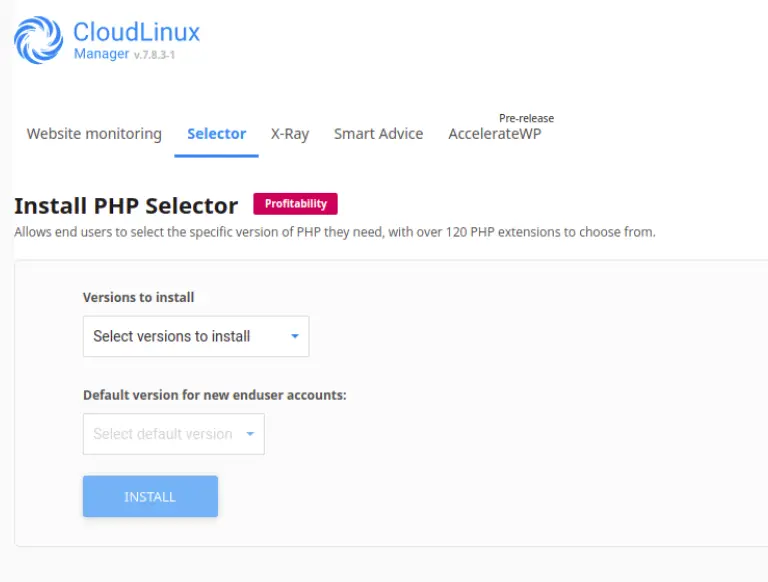
PHP Selector
Overview
PHP Selector is a CloudLinux component which allows users to select PHP versions and modules for particular user’s domains. These PHP versions are provided by CloudLinux and in the list there are newest as well as outdated versions.
How to enable PHP selector
PHP selector is available for SOLO starting from these versions:
liblve-2.1-12
 alt-python27-cllib@3.2.40-1
 lve-wrappers #0.7.8-1
 lve-utils #6.4.6-1
 cagefs #7.5.2-1
 lvemanager #7.8.3-1
To start working with CloudLinux PHP Selector:
- Update packages
yum update lvemanager lve-utils alt-python27-cllib
- Open CloudLinux manager -> Selector tab -> Select PHP versions to install.
PHP Handlers
Compatibility matrix
| Web Server | PHP Selector |
|---|---|
| Apache/suPHP | Yes |
| Apache/FCGID | Yes |
| Apache/CGI | Yes |
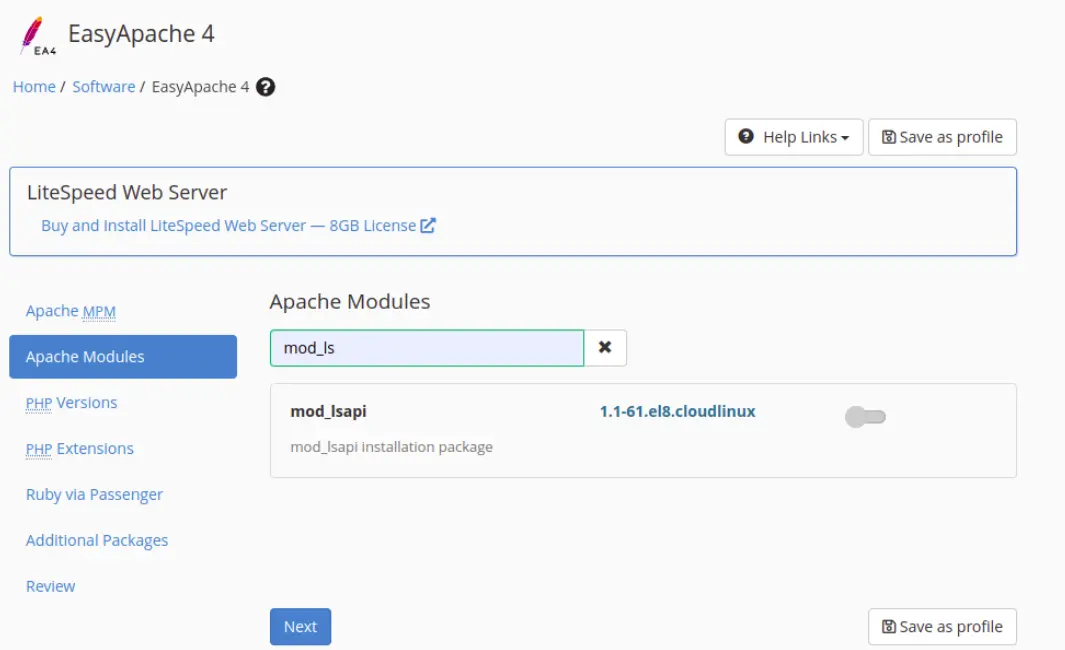
| Apache/mod_lsapi | Yes |
How to install Apache modules
You can use cPanel interface:
Administrator interface
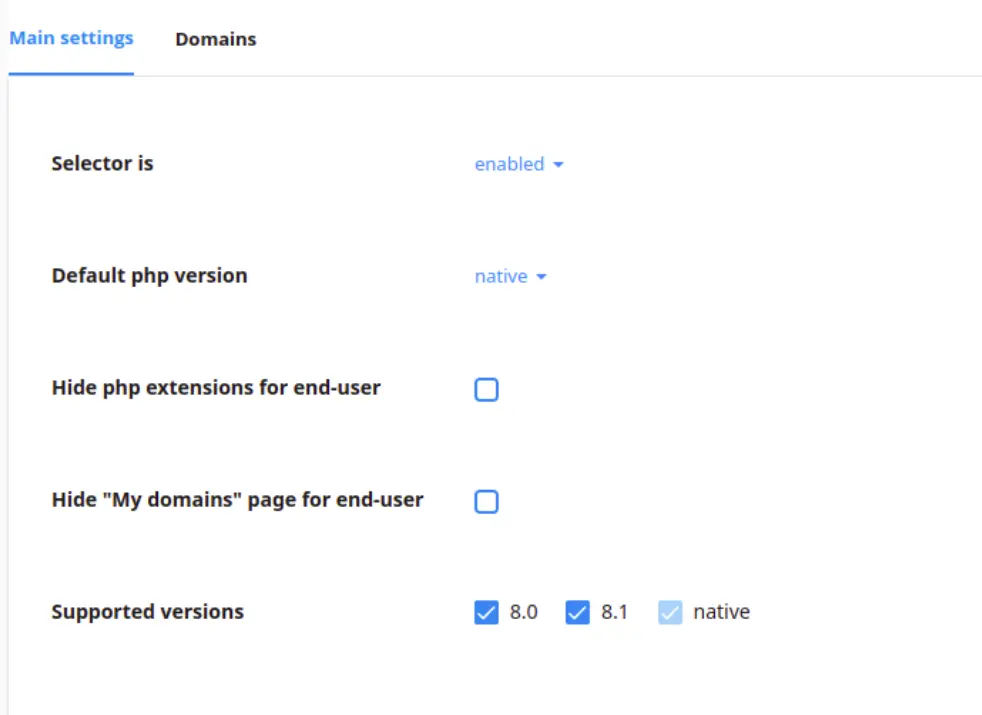
In the Selector tab the diagnostic bar help to monitor configuration of PHP Selector
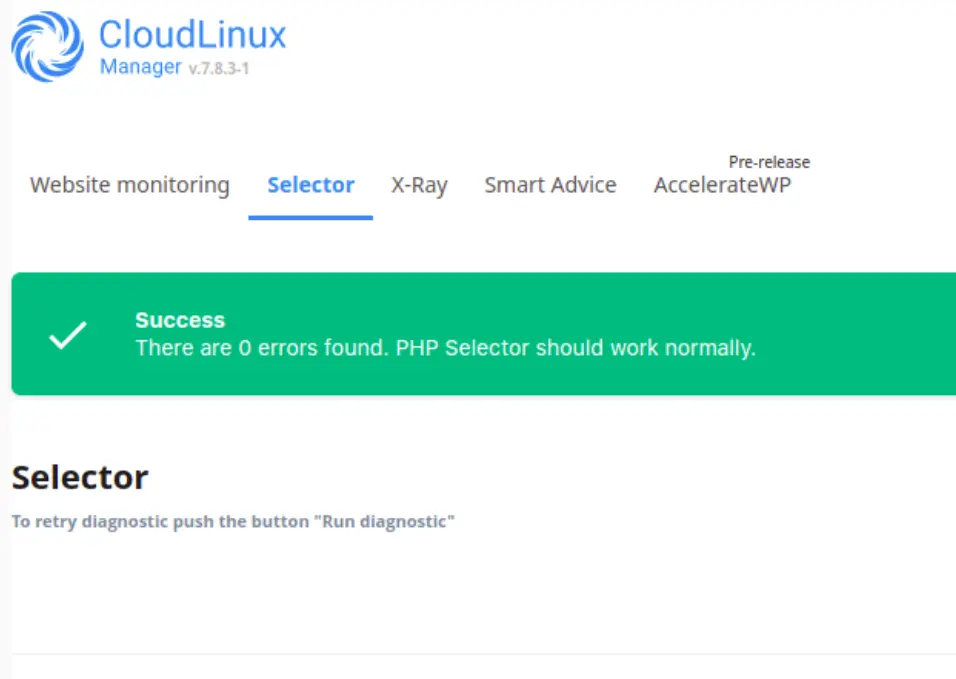
The Main Settings helps to monitor next settings