Deprecated
- Python Selector (Old)
- Git for cPanel
- LVE-Stats 0.x
- OptimumCache
- TPE extension
- CPU limits
- Package integration. You can use Control panel integration guide instead.
- Redis support for HostingLimits
- Migration to EA4
Python Selector (Old)
Note
This documentation is for the old version of Python Selector. You can find documentation for the new Python Selector here
We have the ability to deploy Python applications via application server. Python Selector uses mod_passenger to host Python.
This feature is available for CloudLinux OS Shared 6 or later. It supports only cPanel servers.
You can find a list of supported alt-python versions using the following command.
yum grouplist | grep alt-python
Installation
Note
The instructions below are suitable only for EasyApache 3 and EasyApache 4. You should follow this instruction if you use LiteSpeed.
Install tools to create isolated Python environments and Passenger Apache module. For servers with EasyApache3:
yum install lvemanager alt-python-virtualenv alt-mod-passenger
for EasyApache4:
yum install lvemanager alt-python-virtualenv ea-apache24-mod-alt-passenger
To use Python Selector you should install alternative Python packages:
yum groupinstall alt-python
To use MySQL database you should install alt-python27-devel package:
yum install alt-python27-devel
Note
After installation, please make sure that you have unmarked appropriate checkboxes in LVE Manager Options tab to show Python App in web-interface.
Note
Adding Python modules requires executing permissions to gcc/make binaries. Please enable compilers in Compiler Access section of WHM, then run: cagefsctl --force-update
End user access
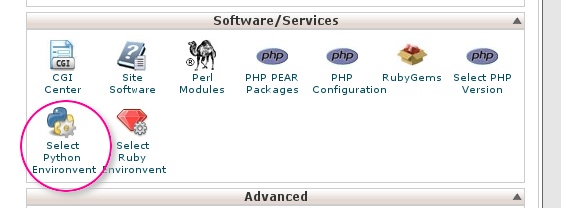
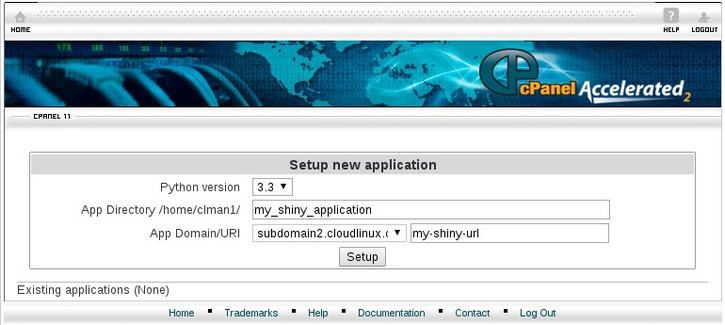
- In Software/Services area choose Select Python Environment.
- Create project form will appear. Choose interpreter version for your application, application folder name (project path) and URI for accessing your application. Click “Create project” to create an application.
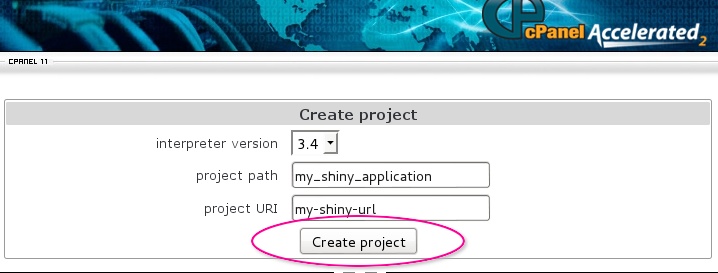
After a little while a new application entry will be appended to the web-page.
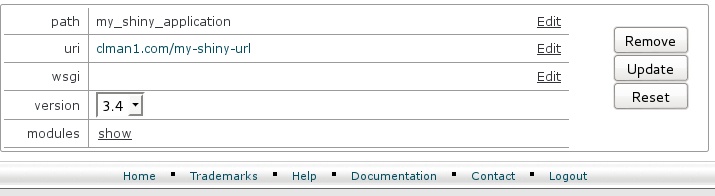
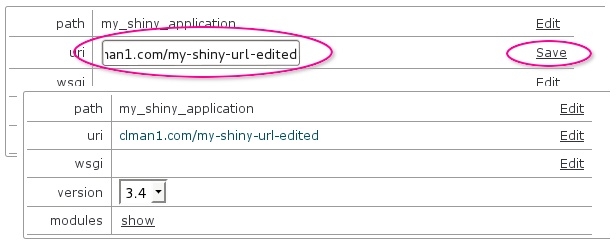
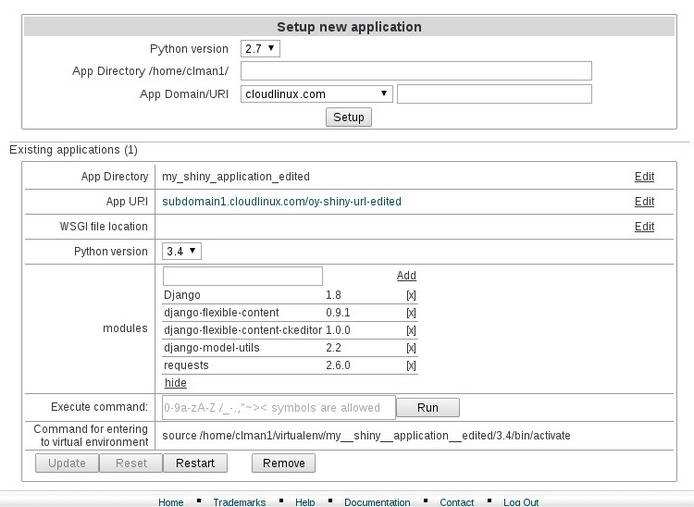
- You can edit path (folder name of the project in the home directory, for example, /home/clman1/project_name ), uri for application, wsgi handler. If you click Edit - the value is converted to input field and thus becomes editable. When editing is complete, click Save .
- Wsgi entry is to specify python wsgi application entry point. It must be specified as filename, must be callable and separated by colon. If your app is running from file flask/run.py by calling callable app, set flask/run.py:app .
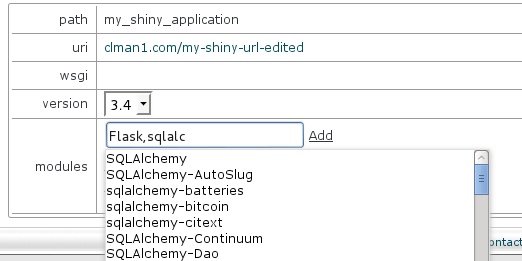
- When Show control is clicked, python extensions section will be expanded. It gives the ability to add or remove python modules. When start typing in input field, appropriate hints are shown in drop-down list. Choose the entry you want from drop-down and click Add .
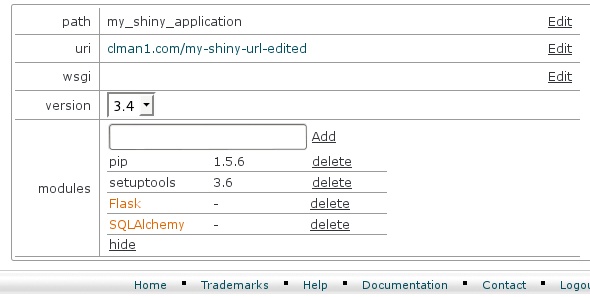
If you click Delete , the corresponding module entry will disappear. In addition to setting path, uri and wsgi , the interpreter version can be changed as well by changing the value in select drop-down.
- No changes are applied to application environment until Update button is clicked. Before the Update button is clicked, all changes can be reverted with Reset button.
The newly created application will be supplied with stub only. A real application ought to be put into application folder. After application is placed into application folder, the wsgi parameter can be set.
Click Remove to delete the application - the application folder itself will remain unmoved.
Note. For LVE Manager version 0.9-10 and higher:
When creating an application you can use the key --domain , which attaches application to domain. If --domain key is not specified, then the main users domain will be used by default. To create application run:
/usr/bin/selectorctl --interpreter=python --version=VERSION[--user=USER] [--domain=DOMAIN] [--print-summary] [--json]–-create-webapp <FOLDER_NAME> <URI>
When changing application URI, --domain key can be used simultaneously, in this case not only URI will be changed, but also the application domain.
To change application URI run:
/usr/bin/selectorctl --interpreter=python [--user=USER][--domain=NEW_DOMAIN] [--print-summary] [--json] --transit-webapp<FOLDER_NAME> <NEW_URI>
The possibility to choose domain when creating an application was added to web interface as well.
Also, you can run simple commands from web interface (e.g. you can install packages from specific repositories or control web applications by means of django -admin).
Hide Python Selector icon
It is possible to hide or show Python Selector icons by marking or unmarking proper checkbox in LVE Manager Options tab.
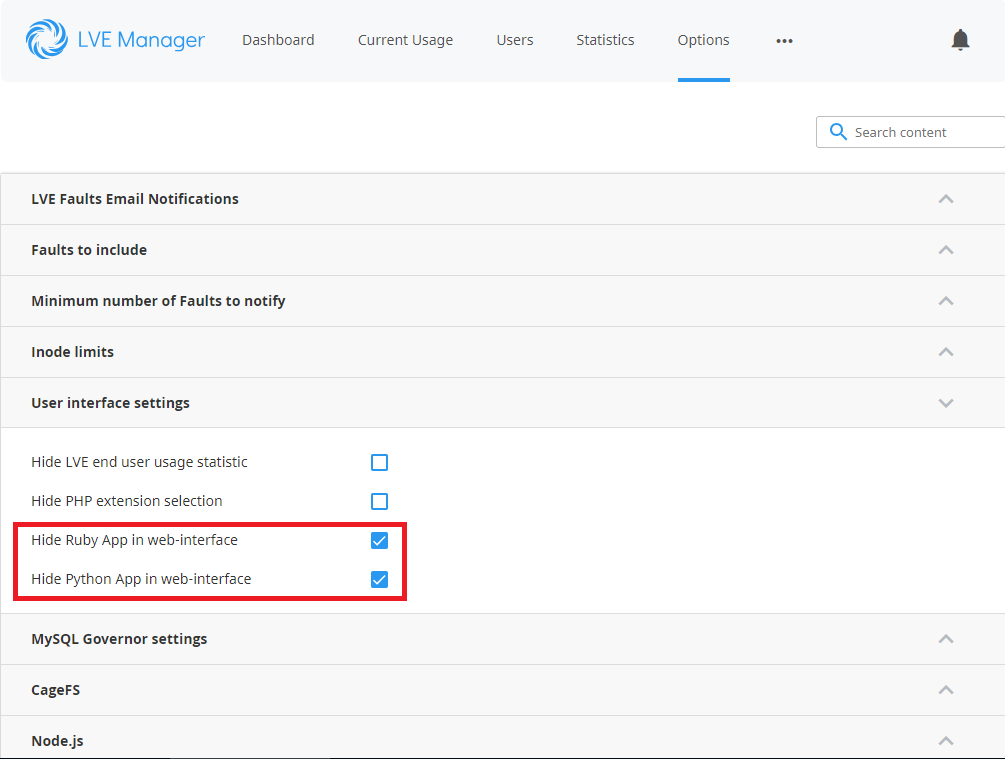
The same result can be accomplished in CLI by running:
cloudlinux-config set --json --data '{"options":{"uiSettings":{"hideRubyApp":false, "hidePythonApp":false}}}'
Note
If you are using cPanel/WHM, you can also configure hide/show CloudLinux OS Shared Python Selectors in WHM | Feature Manager. For that, you’d need to first uncheck Hide Python App in web-interface in the LVE Manager. This will make the menu appear for all accounts. After that, you are free to disable this app in WHM | Feature Manager for the required feature lists.
CLI options for old Python Selector
Warning!
selectorctl command line tool is not supported in the new Python Selector. You can use cloudlinux-selector command line tool instead.
To create application run:
/usr/bin/selectorctl --interpreter=python --version=VERSION [--user=USER] [--print-summary] [--json] --create-webapp <FOLDER_NAME> <URI>
To delete application:
/usr/bin/selectorctl --interpreter=python [--user=USER] [--print-summary] [--json] --destroy-webapp <FOLDER_NAME>
To change application folder name:
/usr/bin/selectorctl --interpreter=python [--user=USER] [--print-summary] [--json] --relocate-webapp <FOLDER_NAME> <NEW_FOLDER_NAME>
To change application URI :
/usr/bin/selectorctl --interpreter=<python|ruby> [--user=USER] [--print-summary] [--json] --transit-webapp <FOLDER_NAME> <NEW_URI>
To change application interpreter version:
/usr/bin/selectorctl --interpreter=python [--user=USER] [--print-summary] [--json] --set-user-current --version=<NEW VERSION> <FOLDER_NAME>
To set application WSGI handler ( Python only):
/usr/bin/selectorctl --interpreter=python [--user=USER] [--print-summary] [--json] --setup-wsgi=<file_path:callable> <FOLDER_NAME>
To install modules to application environment:
/usr/bin/selectorctl --interpreter=python [--user=USER] [--print-summary] [--json] --enable-user-extensions=<module1[,module2...]> <FOLDER_NAME>
To remove modules from application environment:
/usr/bin/selectorctl --interpreter=python [--user=USER] [--print-summary] [--json] --disable-user-extensions=<module1[,module2...]> <FOLDER_NAME>
To list modules installed in application environment:
/usr/bin/selectorctl --interpreter=python [--user=USER] [--print-summary] [--json] --list-user-extensions <FOLDER_NAME>
To print applications summary for a user:
/usr/bin/selectorctl --interpreter=python [--user=USER] [--json] --user-summary
To list available interpreters:
/usr/bin/selectorctl --interpreter=python [--user=USER] [--json] --list
Git for cPanel
Note
This package is no longer supported as it may cause dependency issues
Please note that this package is no longer needed, as since cPanel 11.38, you can install git without any issues on cPanel by running:
yum install git
To install git on cPanel servers:
yum install git-cpanel
LVE-Stats 0.x
Note
LVE-STATS-0.X IS NO LONGER SUPPORTED, PLEASE USE LVE-STATS 2
lve-stats package collects LVE usage statistics and allows to query the data.
To install, run:
yum install lve-stats
If you are already running lve-stats (in case you are running cPanel LVE plugin), run:
yum update lve-stats
This should also be updated automatically next time your system runs system wide update.
The package installs lvestats-server. You can re-start the server by running:
service lvestats restart
The package creates sqlite database /var/lve/lveinfo.db that stores history information about LVE usage. Up to two months of hourly info is stored for each client. The data for the last hour is stored with 5 minutes interval, and the data for the past 10 minutes is stored with 1 minute interval.
LVE Stats updates /var/lve/info every few seconds. That info is used by LVE Manager plugin.
Package consists of lveinfo utility to query LVE usage, and lvechart that allows you to chart usage for individual LVE.
To query historical LVE info, lveinfo command provided. It is located at /usr/sbin/lveinfo:
# /usr/sbin/lveinfo [OPTIONS]
-h --help              : this help screen
-v, --version          : version number
-d, --display-username : try to convert LVE id into username when possible
-f, --from=            : run report from date and time in YYYY-MM-DD HH:MM format
      if not present last 10 minutes are assumed
-t, --to=              : run report up to date and time in YYYY-MM-DD HH:MM format
      if not present, reports results up to now
-o, --order-by=        : orders results by one of the following:
      cpu_avg          : average CPU usage
      cpu_max          : max CPU usage
      mep_avg          : average number of entry processes (concurrent connections)
      mep_max          : max number of entry processes (concurrent connections)
      vmem_avg         : average virtual memory usage
      vmem_max         : max virtual memory usage
      pmem_avg         : average physical memory usage
      pmem_max         : max physical memory usage
      nproc_avg        : average number of processes usage
      nproc_max        : max number of processes usage
      io_avg           : average IO usage
      io_max           : max IO usage
      total_mem_faults : total number of out of virtual memory faults (deprecated since 0.8-6)
      total_vmem_faults: total number of out of virtual memory faults (since 0.8-6)
      total_pmem_faults: total number of out of physical memory faults (since 0.8-6)
      total_mep_faults : total number of entry processes faults (deprecated since 0.8-6)
      total_ep_faults  : total number of entry processes faults (since 0.8-6)
      total_nproc_faults: total number of number of processes faults (since 0.8-6)
      any_faults       : total number of any types of faults (since 0.8-6)
    --id=              : LVE id -- will display record only for that LVE id
-u, --user=            : Use username instead of LVE id, and show only record for that user
-l, --limit=           : max number of results to display, 10 by default
-c, --csv              : display output in CSV format
-b, --by-usage         : show LVEs with usage (averaged or max) within 90% percent of the limit
      available values:
      cpu_avg          : average CPU usage
      cpu_max          : max CPU usage
      mep_avg          : average number of entry processes (concurrent connections)
      ep_avg           : average number of entry processes (since 0.8-6)
      mep_max          : max number of entry processes (concurrent connections)
      ep_max           : max number of entry processes (since 0.8-6)
      mem_avg          : average virtual memory usage
      mem_max          : max virtual memory usage
      vmem_avg         : average virtual memory usage
      vmem_max         : max virtual memory usage
      pmem_avg         : average physical memory usage
      pmem_max         : max physical memory usage
      nproc_avg        : average number of processes
      nproc_max        : max number of processes
      io_avg           : average IO usage
      io_max           : max IO usage
-p, --percentage       : defines percentage for --by-usage option
-f, --by-fault         : show LVEs which failed on max entry processes limit or memory limit
      available values: mem, mep.
      since 0.8-6      : vmem, pmem, ep, nproc
    --show-all         : since 0.8-6 only columns for enabled limits will show up.
-r, --threshold        : in combination with --by-fault, shows only LVEs with number of faults above threshold specified
    --server_id        : used in combination with centralized storage, to access info from any server
    --show-all         : full output (show all limits); brief output by default
Output
| ID | LVE Id or username |
| aCPU | Average CPU usage |
| mCPU | Max CPU usage |
| lCPU | CPU Limit |
| aEP | CPU Limit |
| mEP | Max Entry Processes |
| lEP | Entry Proc limit |
| aNPROC | Average Number of Processes |
| mNPROC | Max Number of Processes |
| lNPROC | Number of Processes limit |
| aVMEM | Average virtual Memory Usage |
| mVMEM | Max virtual Memory Usage |
| lVMEM | Virtual Memory Limit |
| aPMEM | Average physical Memory Usage |
| mPMEM | Max physical Memory Usage |
| lPMEM | Physical Memory Limit |
| aIO | Average IO usage |
| mIO | Max IO usage |
| lIO | IO Limit |
| fVMEM | Out Of Virtual Memory Faults |
| fPMEM | Out Of Physical Memory Faults |
| fEP | Entry processes faults |
| fNPROC | Number of processes faults |
- only enabled limits will show up
Examples
Display top 10 users, by max CPU usage, from Oct 10, 2010 to Oct 15, 2010. Display username if possible:
lveinfo --from='2010-10-10' --to='2010-10-15' -o cpu_max --display-username

ID        aCPU       mCPU     lCPU      aEP      mEP      lEP       aMem       mMem      lMem      MemF     MepF
777         7        9        10        0        0        25        10M        15M       1G        0        0
300         2        8        10        0        1        25        1M         3M        1G        0        0
web2        1        6        10        0        0        25        17K        18M       1G        0        0
web1        0        0        10        0        0        25        204K       1M        1G        0        0
lveinfo --from='2010-10-10' --to='2010-10-15' --user=web2 --display-username

ID        aCPU       mCPU     lCPU      aEP      mEP      lEP       aMem       mMem       lMem      MemF     MepF
web2        1        6        10        0        0        25        10M        15M        1G        0        0
Storing statistics in MySQL
Note
LVE-STATS-0.X IS NO LONGER SUPPORTED, PLEASE USE LVE-STATS 2
You have to install MySQL-python rpm to store lve-stats on centralized server. Run:
yum install MySQL-python
If you have MySQL 5.3+ installed on CloudLinux OS Shared 5 server, and there is no libmysqlclient_r.so.15 on the server, run:
yum --enablerepo=cloudlinux-updates-testing install mysqlclient15
A typical procedure to configure the MySQL database for storing information about multiple servers for lve-stats services looks as follows:
Create database and user. You can do it by executing the following commands:
create database <database>;
grant all on <database>.* to <user> identified by 'password';
flush privileges;
Create database schema:
CREATE TABLE history (id INTEGER,
        cpu INTEGER, cpu_limit INTEGER,
        cpu_max INTEGER,
        ncpu INTEGER,
        mep INTEGER, mep_limit INTEGER,
        mep_max INTEGER,
        io INTEGER, io_limit INTEGER,
        mem INTEGER, mem_limit INTEGER,
        mem_max INTEGER,
        mem_fault INTEGER, mep_fault INTEGER,
        created TIMESTAMP, weight INTEGER, server_id CHAR(10),
        lmemphy INTEGER, memphy INTEGER, memphy_max INTEGER, memphy_fault INTEGER,
        lnproc INTEGER, nproc INTEGER, nproc_max INTEGER, nproc_fault INTEGER,
        lcpuw INTEGER, io_max INTEGER,
        iops INTEGER, liops INTEGER, iops_max INTEGER );
CREATE INDEX idx_history_id ON history(id);
CREATE INDEX idx_history_created ON history(created);
CREATE INDEX idx_history_weight ON history(weight);
CREATE INDEX idx_history_server_id ON history(server_id);
CREATE TABLE last_run (hourly TIMESTAMP, daily TIMESTAMP, server_id CHAR(10), lve_version INTEGER);
CREATE TABLE users (server_id CHAR(10), id INTEGER, username CHAR(20));
CREATE INDEX idx_users_server_id ON users(server_id);
CREATE INDEX idx_users_id ON users(id);

CREATE TABLE history_gov ( ts INTEGER,
                           username CHAR(64),
                           max_simultaneous_requests INTEGER,
                           sum_cpu FLOAT,
                           sum_write FLOAT,
                           sum_read FLOAT,
                           number_of_iterations INTEGER,
                           max_cpu FLOAT,
                           max_write FLOAT,
                           max_read FLOAT,
                           number_of_restricts INTEGER,
                           limit_cpu_on_period_end INTEGER,
                           limit_read_on_period_end INTEGER,
                           limit_write_on_period_end INTEGER,
                           cause_of_restrict INTEGER,
                           weight INTEGER,
                           server_id char(10));

CREATE INDEX idx_history_gov_ts ON history_gov(ts);
CREATE INDEX idx_history_gov_cause_of_restrict ON history_gov(cause_of_restrict);
CREATE INDEX idx_history_gov_number_of_restricts ON history_gov(number_of_restricts);
CREATE INDEX idx_history_gov_max_simultaneous_requests ON history_gov(max_simultaneous_requests);
CREATE INDEX idx_history_gov_server_id ON history_gov(server_id);
CREATE INDEX idx_history_gov_weight ON history_gov(weight);

CREATE TABLE last_run_gov (hourly TIMESTAMP, daily TIMESTAMP, server_id CHAR(10), lve_version INTEGER);


* Execute following SQL command for each remote server for which you want to store
statistics in this database (make sure you substitute _SERVER_NAME_ with the same
servername as used in lvestats config file on remote server:

INSERT INTO last_run(hourly, daily, server_id, lve_version) VALUES (UTC_TIMESTAMP(), UTC_TIMESTAMP(), '_SERVER_NAME_', 4);
On each server edit file /etc/sysconfig/lvestats & /etc/sysconfig/lvestats.readonly as follows:
db_type = mysql
connect_string = host:database:user:password
server_id = _SERVER_NAME_
db_port = _port_
Note
lvestats.readonly should have a user that has read only access to all tables from lvestats database.
Note
SERVER_NAME should be at most 10 characters
Note
db_port is an optional parameter. Default port would be used.
Select server responsible for compacting database on regular bases by setting COMPACT=master in /etc/sysconfig/lvestats for that server. Set COMPACT=slave on all other servers.
Make sure that /etc/sysconfig/lvestats is readable only by root (chmod 600 /etc/sysconfig/lvestats), lvestats.readonly should be readable by anyone
Restart service:
service lvestats restart
If you use central database to store lvestats data, on each server, execute:
/usr/share/lve-stats/save_users_to_database.py
You just need to execute it once, as it will be later executed via cron job . That script will store usernames from each server, so that lve-stats would later be able to correctly identify each user.
Updating MySQL & PostgreSQL schema for lve-stats 0.8+
If you are using MySQL or PostgreSQL server for lve-stats older then 0.8, make sure to do the following steps to upgrade to latest version:
Stop lvestats service on all your servers.
Connect to your database server, and execute following commands:
ALTER TABLE history ADD lmemphy INTEGER;
ALTER TABLE history ADD memphy INTEGER;
ALTER TABLE history ADD memphy_max INTEGER;
ALTER TABLE history ADD memphy_fault INTEGER;
ALTER TABLE history ADD lnproc INTEGER;
ALTER TABLE history ADD nproc INTEGER;
ALTER TABLE history ADD nproc_max INTEGER;
ALTER TABLE history ADD nproc_fault INTEGER;
ALTER TABLE history ADD lcpuw INTEGER;
ALTER TABLE history ADD io_max INTEGER;
UPDATE history SET lmemphy = 0, memphy = 0, memphy_max = 0, memphy_fault = 0,
       lnproc = 0, nproc = 0, nproc_max = 0, nproc_fault = 0,
       lcpuw = 0, io_max = 0;

ALTER TABLE last_run ADD lve_version INTEGER;
UPDATE last_run SET lve_version = 4;
CREATE TABLE last_run_gov (hourly TIMESTAMP, daily TIMESTAMP, server_id CHAR(10), lve_version INTEGER);
CREATE TABLE history_gov ( ts INTEGER,
    username char(64),
    max_simultaneous_requests INTEGER,
    sum_cpu float,
    sum_write float,
    sum_read float,
    number_of_iterations INTEGER,
    max_cpu float,
    max_write float,
    max_read float,
    number_of_restricts INTEGER,
    limit_cpu_on_period_end INTEGER,
    limit_read_on_period_end INTEGER,
    limit_write_on_period_end INTEGER,
    cause_of_restrict INTEGER,
    server_id char(10));

CREATE INDEX idx_history_gov_ts ON history_gov(ts);
CREATE INDEX idx_history_gov_cause_of_restrict ON history_gov(cause_of_restrict);
CREATE INDEX idx_history_gov_number_of_restricts ON history_gov(number_of_restricts);
CREATE INDEX idx_history_gov_max_simultaneous_requests ON history_gov(max_simultaneous_requests);
CREATE INDEX idx_history_gov_server_id ON history_gov(server_id);
ALTER TABLE history_gov ADD weight INTEGER;
CREATE INDEX idx_history_gov_weight ON history_gov(weight);
CREATE TABLE last_run_gov (hourly TIMESTAMP, daily TIMESTAMP, server_id CHAR(10), lve_version INTEGER);
If you use central database to store lvestats data, execute the following commands:
CREATE TABLE users (server_id CHAR(10), id INTEGER, username CHAR(20));CREATE INDEX idx_users_server_id ON users(server_id);CREATE INDEX idx_users_id ON users(id);
/usr/share/lve-stats/save_users_to_database.py
You just need to execute it once, as it will be later executed via cron job. That script will store usernames from each server, so that lve-stats would later be able to correctly identify each user.
Storing statistics in PostgreSQL
Note
LVE-STATS-0.X IS NO LONGER SUPPORTED, PLEASE USE LVE-STATS 2
You have to install postgresql-python rpm to store lve-stats on centralized server.
Run:
yum install postgresql-python
A typical procedure to configure the PostgreSQL database for storing information about multiple servers for lve-stats services looks as follows:
Create a database and a user. You can do it by executing the following commands:
createdb <database>createuser <user>
CREATE TABLE history (id INTEGER,
        cpu INTEGER, cpu_limit INTEGER,
        cpu_max INTEGER,
        ncpu INTEGER,
        mep INTEGER, mep_limit INTEGER,
        mep_max INTEGER,
        io INTEGER, io_limit INTEGER,
        mem INTEGER, mem_limit INTEGER,
        mem_max INTEGER,
        mem_fault INTEGER, mep_fault INTEGER,
        created TIMESTAMP, weight INTEGER, server_id CHAR(10),
        lmemphy INTEGER, memphy INTEGER, memphy_max INTEGER, memphy_fault INTEGER,
        lnproc INTEGER, nproc INTEGER, nproc_max INTEGER, nproc_fault INTEGER,
        lcpuw INTEGER, io_max INTEGER,


        iops_max: INTEGER, liops: INTEGER, iops: INTEGER);

CREATE INDEX idx_history_id ON history(id);
CREATE INDEX idx_history_created ON history(created);
CREATE INDEX idx_history_weight ON history(weight);
CREATE INDEX idx_history_server_id ON history(server_id);
CREATE TABLE last_run (hourly TIMESTAMP, daily TIMESTAMP, server_id CHAR(10), lve_version INTEGER);
CREATE TABLE users (server_id CHAR(10), id INTEGER, username CHAR(20));CREATE INDEX idx_users_server_id ON users(server_id);
CREATE INDEX idx_users_id ON users(id);

CREATE TABLE history_gov ( ts INTEGER,
    username char(64),
    max_simultaneous_requests INTEGER,
    sum_cpu float,
    sum_write float,
    sum_read float,
    number_of_iterations INTEGER,
    max_cpu float,
    max_write float,
    max_read float,
    number_of_restricts INTEGER,
    limit_cpu_on_period_end INTEGER,
    limit_read_on_period_end INTEGER,
    limit_write_on_period_end INTEGER,
    cause_of_restrict INTEGER,
    weight INTEGER,
    server_id char(10));

CREATE INDEX idx_history_gov_ts ON history_gov(ts);
CREATE INDEX idx_history_gov_cause_of_restrict ON history_gov(cause_of_restrict);
CREATE INDEX idx_history_gov_number_of_restricts ON history_gov(number_of_restricts);
CREATE INDEX idx_history_gov_max_simultaneous_requests ON history_gov(max_simultaneous_requests);
CREATE INDEX idx_history_gov_server_id ON history_gov(server_id);
CREATE INDEX idx_history_gov_weight ON history_gov(weight);

CREATE TABLE last_run_gov (hourly TIMESTAMP, daily TIMESTAMP, server_id CHAR(10), lve_version INTEGER);

     * Execute following SQL command for each remote server for which you want to store
      statistics in this database (make sure you substitute _SERVER_NAME_ with the same
      servername as used in lvestats config file on remote server:

INSERT INTO last_run(hourly, daily, server_id, lve_version) VALUES (now() AT TIME ZONE 'UTC', now() AT TIME ZONE 'UTC', '_SERVER_NAME_', 4);
db_type = postgresql
connect_string = host:database:user:password
server_id = _SERVER_NAME_db_port = _port_
Note
lvestats.readonly should have a user that has read only access to history table.
Note
SERVER_NAME should be at most 10 characters
Note
db_port is optional, default PostgreSQL port will be used
Select server responsible for compacting database on regular bases by setting COMPACT=master in /etc/sysconfig/lvestats for that server. Set COMPACT=slave on all other servers.
Make sure that /etc/sysconfig/lvestats is readable only by root (chmod 600 /etc/sysconfig/lvestats), lvestats.readonly should be readable by anyone.
Restart service:
service lvestats restart
/usr/share/lve-stats/save_users_to_database.py
You are done!
Compacting in multi-server settings
Note
LVE-STATS-0.X IS NO LONGER SUPPORTED, PLEASE USE LVE-STATS 2
[lve-stats 0.10+]
When you have multiple servers storing LVE statistics to a central database, then you will need to pick one server responsible for compacting data.
On that server, edit file: /etc/sysconfig/lvestats and change the option COMPACT to master.
On all other servers, change that option to slave.
Default: single – should be used when lve-stats stores data to a single database.
OptimumCache
Note
OPTIMUMCACHE IS NO LONGER SUPPORTED.
OptimumCache 0.2+
OptimumCache is a de-duplicating file cache optimized specifically for shared hosting. Typical shared hosting server runs a number of sites with WordPress and Joomla as well as other popular software. This usually means that there are hundreds of duplicate files that are constantly being read into file cache - both wasting precious disk IO operations as well as memory. OptimumCache creates a cache of such duplicated files and de-duplicates file cache. 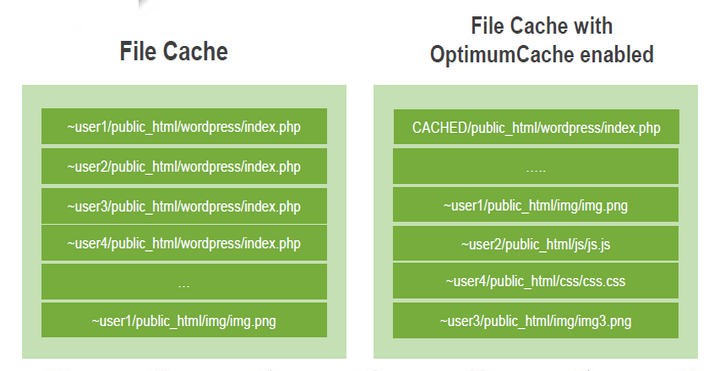
With OptimumCache, if a duplicate of an already loaded file is requested, the file gets loaded from filesystem cache. By doing that, system bypasses disk IO, significantly improving the speed of reading that file, while lowering load on the hard disk. As the file had been read from disk just once, it is cached by filesystem cache just once, minimizing amount of duplicates in file system cache and improving overall cache efficiency. This in turn reduces memory usage, decreases the number of disk operations - all while improving the websites response time.
Installation
NOTE
OPTIMUMCACHE IS NO LONGER SUPPORTED
Requirements
- 64bit CloudLinux OS Shared 6.x or higher
- ext4 filesystem
- kernel lve1.2.55 or later.
Installation
yum install optimumcache
OptimumCache must be provided with list of directories to expect duplicate files be in:
# occtl --recursive --mark-dir /home# occtl --recursive --mark-dir /home2(for cPanel)# occtl --recursive --mark-dir /var/www(for Plesk)
OptimumCache is going to index these directories. Thus system load during this period (from hours to days) might be as twice as high. See Marking directories.
Allocating Disk Space for OptimumCache:
By default OptimumCache will attempt to setup 5GB ploop (high efficiency loopback disk) to be used for the cache in /var/share/optimumcache/optimumcache.image
That ploop will be mounted to: /var/cache/optimumcache
The ploop image will be located at /var/share/optimumcache/optimumcache.image
Allocating OptimumCache disk space for ploop on a fast drives (like SSD) will provide additional performance improvement as more duplicated files would be loaded from fast disks into memory.
Moving ploop image to another location:
occtl --move-ploop /path/to/new/image/file [new size[KMGT]]
/path/to/new/image/file must be file path + file name, not a directory name.
Example:
occtl --move-ploop /var/ssh/optimumcache.image
If new size is not mentioned, then value from /etc/sysconfig/optimumcache is used. If /etc/sysconfig/optimumcache does not mention anything regarding ploop image size, then default 5GB is used.
Enabling and disabling ploop:
To turn on ploop:
occtl --init-ploop
To disable ploop:
occtl --disable-ploop
If ploop image has been mounted in /etc/fstab for OpimumCache-0.1-21 and earlier, you may consider removing this fstab entry in OpimumCache 0.2+. That is because since 0.2+ ploop is mounted automatically at service start.
If you prefer leave that fstab mount point as is, you may see some warnings when you decide to move ploop later via occtl --move-ploop.
Resizing ploop:
To resize ploop:
occtl --resize-ploop [new size[KMGT]]
A common reason for resizing ploop is reacting to OptimumCache syslog message like “OptimumCache recommends cache storage size to be at least … GB”.
Deleting ploop:
occtl --delete-ploop
For the case when this action cannot be completed due to “Unable unmount ploop” issue, there is a workaround in “Troubleshooting” section.
Q. I created/resized/moved/deleted ploop. Do I need to rerun the initial mark process?
А. Not needed.
Using without ploop
Note
OPTIMUMCACHE IS NO LONGER SUPPORTED
On servers with kernel prior to lve1.2.55 ploop will not be used (due to ploop related issues in the kernel). Instead cached files will be stored in /var/cache/optimumcache.
The cache will be cleaned (shrunk) by 20% once partition on which OPTIMUMCACHE_MNT resides has only 10% of free space. You can change that by changing PURGEAHEAD param in /etc/sysconfig/optimumcache, and restarting optimumcache service.
The cache is cleaned /etc/cron.d/optimumcache_cron script optimumcache_purge, which runs every minute:
0-59 * * * * root /usr/share/optimumcache/optimumcache_purge
Marking directories
Note
OPTIMUMCACHE IS NO LONGER SUPPORTED
Marking directories to be cached:
occtl --mark-dir /path/to/site/on/filesystem --recursive
In common scenario admin marks for caching user directories:
occtl --mark-dir /home /home2 /home3 --recursive
OptimumCache is going to index these directories. Thus system load during this period (from hours to days) might be as twice as high. You can check indexing job status with at -l at any time.
Ignoring particular files & directories:
OptimumCache tracks files & directories that need to be cached. Once file is modified, it will no longer be tracked by OptimumCache (as there is very little chance that it will have a duplicate). Yet, all new files created in tracked directories are checked for duplicates.
Sometimes you might want to ignore such checks for directories where large number of temporary or new files are created, that will not have duplicates - as such checks are expensive. Directories like mail queue, and tmp directories should be ignored.
You can set a regexp mask for directories that you would like to ignore using:
occtl --add-skip-mask REGEX
To list skip masks:
occtl --list-skip-mask
To remove skip mask:
occtl --remove-skip-mask ID\|Tag
At the very end, for those changes to take effect:
occtl --check
occtl --check is the same lengthy operation as marking is. Thus, it’s usage has to be sane, especially for big home (>500G).
By default, OptimumCache sets up following skip masks:
| id | tag | regex |
| 1 | all_dot_files | /\...* |
| 2 | cagefs | ^/home/cagefs-skeleton$ |
| 3 | cagefs | ^/home/cagefs-skeleton/ |
| 4 | cpanel | ^/home[^/]*/cPanelInstall |
| 5 | cpanel | ^/home[^/]*/cpeasyapache |
| 6 | cpanel | ^/home[^/]*/aquota |
| 7 | cpanel | ^/home[^/]*/jailshell |
| 8 | cpanel | ^/home[^/]*/[^/]+/mail$ |
| 9 | cpanel | ^/home[^/]*/[^/]+/mail/.* |
| 10 | cpanel | ^/home[^/]*/[^/]+/logs$ |
| 11 | cpanel | ^/home[^/]*/[^/]+/logs/.* |
| 12 | cpanel | ^/home[^/]*/[^/]+/\.cpanel$ |
| 13 | cpanel | ^/home[^/]*/[^/]+/\.cpanel/.* |
| 14 | cpanel | ^/home[^/]*/[^/]+/\.cagefs |
| 15 | cpanel | ^/home[^/]*/[^/]+/\.cagefs/.* |
| 16 | cpanel | ^/home[^/]*/virtfs |
| 17 | cpanel | ^/home[^/]*/virtfs/.* |
| 18 | not_a_userdir | ^/home/tmp/ |
| 19 | not_a_userdir | ^/home/tmp$ |
| 20 | not_a_userdir | ^/home/ftp/ |
| 21 | not_a_userdir | ^/home/ftp$ |
| 22 | not_a_userdir | ^/home/admin/ |
| 23 | not_a_userdir | ^/home/admin$ |
| 24 | quota | ^/home[^/]*/quota.user$ |
| 25 | usermisc | /quota.user$ |
| 26 | users_home | ^/home/[^/]+/backups$ |
| 27 | users_home | ^/home/[^/]+/backups/ |
| 28 | users_home | ^/home/[^/]+/imap$ |
| 29 | users_home | ^/home/[^/]+/imap/ |
| 30 | users_home | ^/home/[^/]+/Maildir$ |
| 31 | users_home | ^/home/[^/]+/Maildir/ |
| 32 | users_home | ^/home/[^/]+/domains/[^/]+/logs$ |
| 33 | users_home | ^/home/[^/]+/domains/[^/]+/logs/ |
| 34 | users_home | ^/home/[^/]+/domains/[^/]+/public_ftp$ |
| 35 | users_home | ^/home/[^/]+/domains/[^/]+/public_ftp/ |
| 36 | users_home | ^/home/[^/]+/domains/[^/]+/stats$ |
| 37 | users_home | ^/home/[^/]+/domains/[^/]+/stats/ |
This information is stored in /etc/container/optimumcache/ignore.d/.
Skip mask syntax
Skip masks use following regexp syntax: http://www.greenend.org.uk/rjk/tech/regexp.html
For example, to disable caching all directories that contain */cache/*, you should use skip masks like:
/cache/
/cache$
This information is stored in /etc/container/optimumcache/ignore.d/
OptimumCache configuration file
Note
OPTIMUMCACHE IS NO LONGER SUPPORTED
/etc/sysconfig/optimumcache
OPTIMUMCACHE_MNT=/var/cache/optimumcache


# Valency to cache

COUNT=0


# Minimal file size to cache, default - cache all files

# MINSIZE=0


# Minimal page number in file to start caching, default - 1

PAGEMIN=0


# Maximum file size to cache, 10485760 (10MB) by default

# MAXSIZE


# Interval between caching attempts, default - 5 seconds

# TIMEOUT=7


# Adaptive timeout upper limit (seconds)

# MAXTIMEOUT=160


# Adaptive timeout multiplicator and divisor

# TIMEOUT_INCR_MUL=2

# TIMEOUT_DECR_DIV=4


# Buffer size in KB for 'optimumcache dump', default is 32MB

# DUMP_BUFFER_SIZE=32000


# Extra space in %% of requested to purge, default 20%

# PURGEAHEAD=20


# Experimental: Eliminate frequent sync to address IO performance

NOIMMSYNC=1


# Logging verbosity, default - 1, verbose

# LOGLEVEL=1


# occtl --mark-dir or --check operations IO limit, MB/s, default is 5 MB/s

# OCCTL_LVE_IO_LIMIT=5


# occtl --mark-dir or --check operations %cpu limit, default is 50% of one CPU core

# OCCTL_LVE_SPEED_LIMIT=50


# Lve ID to associate limits with

# LVEID=5


# Collect perf statistics in /var/log/optimumcache_perf. Default is enabled.

# PERF_LOG_ENABLED=1
Command-line interface
Note
OPTIMUMCACHE IS NO LONGER SUPPORTED
OptimumCache is controlled using occtl command line utility.
Usage:
occtl.py    [-h] [--move-ploop param [param ...]] [--check] [--verbose]

            [--init-ploop [param [param ...]]] [--resize-ploop New Size]

            [--disable-ploop] [--enable-ploop] [--mount-ploop]

            [--unmount-ploop] [--delete-ploop] [--unmark-all]

            [--mark-dir Path [Path ...]] [--unmark-dir Path [Path ...]]

            [--recursive]  [--add-skip-mask Regex]

            [--remove-skip-mask Id|Tag] [--list-skip-mask] [--silent]

            [--ignore-unmount-failure] [--no-lve-limits] [--foreground]

            [--ploop-status] [--remount-cached-points] [--purge]

            [--cancel-pending-jobs] [--report [Period]]

            [--recommend-minmax-size]
Display numbers/percents of cached files:
optimumcache stat
or
optimumcache stat /home
To display statistic for specific mount. In depth display what is being held in cache:
optimumcache dump [--resolve-filenames] [mount]
The option --resolve-filenames is experimental and may not apply to all output cached entries.
Optional Arguments:
-h, --help | Show this help message and exit. |
--move-ploop param [param ...] | Move cache from one ploop image to /path/to/new/image/location [New Size[KMGT]]. |
--check | Check marked files for errors. This task is scheduled as background job, unless --foreground is specified. |
--verbose | List what is being checked. |
--init-ploop [param [param ...]] | Create ploop image for the cache [/path/to/ploop/image [ploop_size] | ploop_size] - if only one parameter is given, it is considered to be ploop size. Size should be a NUMBER[KMGT]. |
--resize-ploop New Size | New Size NUMBER[KMGT]. |
--disable-ploop | Disable ploop. |
--enable-ploop | Enable ploop. |
--mount-ploop | Mount ploop image. |
--unmount-ploop | Unmount ploop image. |
--delete-ploop | Delete ploop image. Implies disable ploop, if was enabled. |
--unmark-all | Unmark all marked directories. |
--mark-dir Path [Path ...] | Mark directory for caching.This task is scheduled as background job, unless --foreground is specified. |
--unmark-dir Path [Path ...] | Unmark directory for caching. |
--recursive | Is used with mark/unmark dir. |
--add-skip-mask Regex | Regexp to skip files/directories for caching. |
--remove-skip-mask Id|Tag | Remove regexp to skip files/directories by id or tag. |
--list-skip-mask | List regexp to skip files/directories. |
--silent | Do not echo status to stdout/syslog. |
--ignore-unmount-failure | Ignore cannot unmount ploop problem. |
--no-lve-limits | Ignore default LVE limits for --mark-dir and --check commands. Also implies --foreground. |
--foreground | Don't spawn --mark-dir and --check commands in background. |
--ploop-status | Check if ploop is mounted. |
--purge | Purge cache storage (takes some time). |
--cancel-pending-jobs | Cancel --mark-dir and --check commands if were queued or are being run in background. |
--report [Period] | Report statistics for Period (hourly |
cloudlinux-collect: collect system load statistics
- cloudlinux-collectl: quick start
- Install
- Measure web site response time
- To watch what is being collected
- Statistics being collected in details
- Statistics manual configuration
- Running statistics daemon: collectl-cloudlinux
- Analyzing the results
Note
OPTIMUMCACHE IS NO LONGER SUPPORTED
cloudlinux-collectl: quick start
Installing this package automatically starts system load statistics collection in background. cloudlinux-collectl package has no strict dependency on OptimumCache, thus the statistics is collected regardless of whether OptimumCache is installed or not. The aim of having this package pre-installed is to compare system performance before and after installing OptimumCache, thus to measure OptimumCache effectiveness.
Install
yum install cloudlinux-collect --enablerepo=cloudlinux-updates-testing
Note
cloudlinux-collectl will be installed automatically on optimumcache upgrade to 0.2-23
Measure web site response time
cloudlinux-collectl can monitor response time for a configurable set of URLs.
Start monitoring new URL:
cloudlinux-collect --addurl <alias> <http://url
Example:
cloudlinux-collect --addurl localhost http://127.0.0.1/index.php
Try cloudlinux-collectl --help for more options.
To watch what is being collected
cloudlinux-collect --test
Actual logs are compressed with gzip and kept in /var/log/optimumcache/collectl directory.
Statistics being collected in details
To monitor what statistics are being collected, try command:
cloudlinux-collect --test
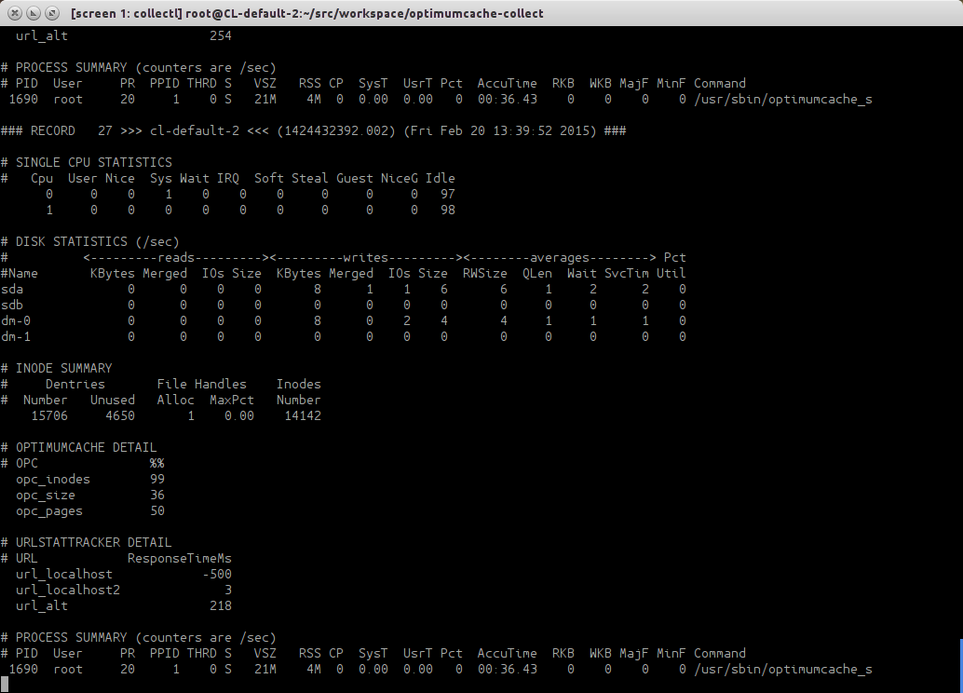
Along with common statistics blocks as CPU , disk usage, inodes cached, there are two blocks of data to watch how effectively OptimumCache is functioning.
OPTIMUMCACHE DETAIL refers to data, which is similar to output of command
optimumcache stat
csums:          4964 (99.9%)

             fetched        uncached            cached

inodes:          4967            31               4936    (99.4%)

size:          204177          131072           73104     (35.8%)

RAM:                8              4                4     (50.0%)
Particularly, the last column percent numbers shall match.
The next goes URLSTATTRACKER DETAIL block with url response time in milliseconds. Negative values here may pop up unexpectedly. Negative numbers are not milliseconds, but signal about http error response code for that specific url. For instance, -403 will signal for Forbidden http error. As for -500 value, it signals not only for Internal Server Error, but can be displayed, when there is connection problem with the server, which is specified by the url.
Statistics manual configuration
URLSTATTRACKER DETAIL is the only statistics, which requires manual configuration. Upon clean installation, it has only url_localhost preconfigured:
cloudlinux-collect --info
url shortname            url

--------------------         ---

localhost                 http://localhost/
To add another URL for monitoring:
cloudlinux-collect --addurl alt http://192.168.0.102/
To display URLs being monitored list:
cloudlinux-collect --info
url shortname          url

--------------------          ---

alt                        http://192.168.0.102/

localhost                  http://localhost/
To skip URL from being tracked run command:
cloudlinux-collect --skip <url short name>
Running statistics daemon: collectl-cloudlinux
cloudlinux-collectl has got collectl package as a dependency. Initd script /etc/init.d/cloudlinux-collectl will automatically bring up another instance of collectl named collectl-optimumcache . collectl-optimumcache daemon instance has a separate config and does not interfere with other running pre-configure collectl daemon (if any).
As it was mentioned, collectl-optimumcache daemon starts automatically on package install, then on server restart events, kicked by regular Initd script /etc/init.d/cloudlinux-collectl. Thus, checking the daemon status, stop, restart is trivial:
service cloudlinux-collect status

collectl-optimumcache (pid  1745) is running…
To start /stop:
service cloudlinux-collect < start | stop >
Analyzing the results
The statistics is being collected into files named %hostname%-%datetime%.raw.gz under directory /var/log/cloudlinux-collect.
To convert those info format suitable for loading into Excel, LibreOffice Calc, another data mining tool, run the command:
cloudlinux-collect --genplotfiles
Generate fresh plot files in

         /var/log/cloudlinux-collect/plotfiles
Uninstall OptimumCache
Note
OPTIMUMCACHE IS NO LONGER SUPPORTED
To uninstall OptimumCache, run:
service optimumcache stop
occtl --delete-ploop
:>/var/share/optimumcache_store
yum remove optimumcache
If available, reboot server
After the reboot pfcache= mount options will disappear by themselves.
For OptimumCache version prior 0.2-11, uninstalling via rpm package manager does not automatically removes away ploop image. That is because not always possible to unmount it properly due to kernel dependency. If there is no luck with unmounting ploop, then the server will have to be rebooted and will need to remove ploop files manually:
rm /var/share/optimumcache/optimumcache.image
rm /var/share/optimumcache/DiskDescriptor.xml
rm /var/share/optimumcache/DiskDescriptor.xml.lck
rm /path/to/ploop/image/file
rm /path/to/ploop/image/DiskDescriptor.xml
rm /path/to/ploop/image/DiskDescriptor.xml.lck
For OptimumCache version 0.2-11 and later, ploop image will be removed automatically during uninstall. If ploop unmount issue prevents doing that, ploop image clean up will be scheduled after next server reboot.
If uninstall OptimumCache process lasts for too long, please find the solution in Troubleshooting section of this document.
Troubleshooting
- Installing for FS is different from Ext4
- Yum fails to install Perl rpms coming with OptimumCache
- OptimumCache prior 0.2-23: Cannot unmount old ploop image
- High IO rate
- High CPU utilization
- Uninstalling OptimumCache lasts for too long
- ‘Failed to attach peer: Invalid argument’ appears in syslog
Note
OPTIMUMCACHE IS NO LONGER SUPPORTED
Installing for FS is different from Ext4
For now Ext4 is the only supported file system type. If a host has no Ext4 filesystem mounted, OptimumCache package installation will be abandoned:
Preparing packages for installation...
Cannot continue: Ext4 partition is the only supported by OptimiumCache, there is no one in fstab
error: %pre(optimumcache-0.1-22.el6.cloudlinux.x86_64) scriptlet failed, exit status 1
error:   install: %pre scriptlet failed (2), skipping
Also, an attempt to add for caching directory, which does not reside on Ext4, will fail:
occtl --mark-dir /home --recursive

mount: / not mounted already, or bad option
optimumcache: Can not mount device. rc[8192]
Error: mark[1]: /usr/bin/optimumcache mark --recursive /home
Yum fails to install Perl rpms coming with OptimumCache
If got this error with yum install optimumcache
Error: Package: cloudlinux-collect-0.1-6.el6.noarch (cloudlinux-x86_64-server-6)

Requires: perl(Config::Tiny)

Error: Package: cloudlinux-collect-0.1-6.el6.noarch (cloudlinux-x86_64-server-6)

Requires: perl(IO::Socket::SSL)

Error: Package: cloudlinux-collect-0.1-6.el6.noarch (cloudlinux-x86_64-server-6)

Requires: perl(YAML::Tiny)

Error: Package: cloudlinux-collect-0.1-6.el6.noarch (cloudlinux-x86_64-server-6)

Requires: perl(IPC::Run)

You could try using --skip-broken to work around the problem

You could try running: rpm -Va --nofiles --nodigest
Most probably you have excluded perl* packages in /etc/yum.conf file, in this case to install OptimumCache run:
yum install optimumcache --disableexcludes=all
OptimumCache prior 0.2-23: Cannot unmount old ploop image
This is well-known ploop problem, which may result in failing such actions as resizing or moving ploop in OptimumCache. To workaround this problem use --ignore-unmount-failure with --move-ploop
occtl --move-ploop --ignore-unmount-failure
As for resizing ploop, use flavor of --move-ploop command instead:
occtl --move-ploop /path/to/new/image/file [size GB] --ignore-unmount-failure
For your changes to take effect, the server has to be rebooted. Upon reboot, you may clean up manually old ploop image file and DiskDescriptor.xml file, which resides in the same directory along with old image.
High IO rate
High IO problem was fixed in latest version of OptimumCache (version 0.2-6). The fix is to eliminate superflows fsync() calls in OptimumCache operations. To activate this fix in existing installation, flag NOIMMSYNC=1 has to be manually set in /etc/syscoconfig/optimumcache.
To ensure that this parameter is set ON in the config, set LOGLEVEL=2 and execute service optimumcache restart. You will see something like this:
optimumcache[1770]: Hash-size: 100000000 min-size: 0 max-size: 18446744071562067968
optimumcache[1770]: Count: 0 Timeout: 5
optimumcache[1770]: Max Timeout: 160 Adaptive Timeout Mul/Div: 2/4
optimumcache[1770]: Iolimit: 0 iopslimit: 0
optimumcache[1770]: No immediate fsync: Yes
optimumcache[1771]: Starting OptimumCache monitor
To update to version 0.2-6, run:
yum update optimumcache --enablerepo=cloudlinux-updates-testing
High CPU utilization
Once it is detected that OptimumCache overuses CPU, it is useful to check, whether checksums reindexing process is running. When reindexing is running, high CPU usage is ok, as far it will certainly drop down after reindexing finished.
Can be checked in /var/log/messages
grep Reindexing /var/log/messages

Feb  4 17:00:55 CL-default-2 occtl[2654]: Reindexing started
If the last line from the output is not Reindexing finished…, than indexing is in progress.
Also, can be checked via command occtl --report, watch if PFL_REINDEX_NUM_FILES and PFL_REINDEX_THOUGHPUT_KB identifiers are present in the last series of data:
occtl --report


- Period starts at: 2015-02-04 17:00
Period Stat:

PFL_ATTACHED:                    170318
PFL_CREATED:                     161583
PFL_ERR_BAD_CSUM:                176
PFL_ERR_INODES:                  879
PFL_FAILED_TO_ATTACH_PEER:       791
PFL_FAILED_TO_ATTACH_PEER_EBUSY: 791

PFL_INODE_IN:                    406167
PFL_PAGEMIN_FILTERED_OUT:        233418
PFL_PAGEMIN_USED:                136082
PFL_REINDEX_NUM_FILES:           192810
PFL_REINDEX_THOUGHPUT_KB:        2904007
PFL_RESTART:                     1
Uninstalling OptimumCache lasts for too long
Uninstalling OptimumCache takes time because of files unmark process, which lasts proportionally to number of files, previously marked for caching with occtl --mark-dir.... If you see, that yum remove optimumcache command is stuck and you have no time to wait for it to finish, or IO load, caused by unmarking files, is undesirable for you, open another console terminal and invoke:
occtl --cancel-pending-jobs
This command will cancel unmark operation, being run by yum under the hood. So that yum uninstall package transaction will complete very soon.
‘Failed to attach peer: Invalid argument’ appears in syslog
Rather rare problem, try to forcibly update optimumcache_s with ploop status.
occtl --remount-cached-points
TPE extension
TPE (Trusted Path Execution)
The kernel supports TPE feature out of the box. You can configure it using following files:
·        /proc/sys/kernel/grsecurity/grsec_lock
·        /proc/sys/kernel/grsecurity/tpe
·        /proc/sys/kernel/grsecurity/tpe_gid
·        /proc/sys/kernel/grsecurity/tpe_restrict_all
To enable TPE feature in a standard way just add following to the end of your /etc/sysctl.conf
#GRsecurity
kernel.grsecurity.tpe = 1
kernel.grsecurity.tpe_restrict_all = 1
kernel.grsecurity.grsec_lock = 1
And do:
sysctl -p
Note
Once you set grsec_lock to 1, you will not be able to change TPE options without reboot.
This Trusted Path Execution feature was adopted from grsecurity.
CPU limits
CPU limits before lve-utils 1.4
CPU Limits are set by CPU and NCPU parameters. CPU specifies the % of total CPU of the server available to LVE. NCPU specifies the number of cores available to LVE. The smallest of the two is used to define how much CPU power will be accessible to the customer.
| Cores Per Server | CPU Limit | NCPU Limit | Real limit |
| 1 | 25% | 1 | 25% of 1 core |
| 2 | 25% | 1 | 50% of 1 core |
| 2 | 25% | 2 | 50% of 1 core |
| 4 | 25% | 1 | 100% of 1 core (full core) |
| 4 | 25% | 2 | 1 core |
| 4 | 50% | 1 | 1 core |
| 4 | 50% | 2 | 2 cores |
| 8 | 25% | 1 | 1 core |
| 8 | 25% | 2 | 2 cores |
| 8 | 50% | 2 | 2 cores |
| 8 | 50% | 3 | 3 cores |
When user hits CPU limit, processes within that limit are slowed down. For example, if you set your CPU limit to 10%, and processes inside LVE want to use more then 10% they will be throttled (put to sleep) to make sure they don't use more then 10%. In reality, processes don't get CPU time above the limit, and it happens much more often then 1 second interval, but the end result is that processes are slowed down so that their usage is never above the CPU limit set.
Package integration
Note
Deprecated.
Note
You can use Control panel integration guide instead.
[lve-utils 1.4+]
CloudLinux OS Shared can automatically detect the most popular control panels, like cPanel - and allows to set different limits for users in different packages. It simplifies management as you don't have to choose between one limit that fits all your customers on the server, or individual limits for the customers.
If you have a custom made control panel, with your own 'package' implementation, you can still use CloudLinux OS Shared framework to manage limits for your packages.
To do that, you would need:
Implement script that would map users to packages.
Configure lvectl to use your script.
Implementing script
A script can be written in any language, and it has to be executable.
It should accept the following arguments:
--list-all prints [userid package] pairs
Output should look like a list of space separate pairs of user Linux IDs and package names.
100 package1
101 package1
102 package2
103 package3
--userid=id prints package for a user specified
Output should contain package name, like:
package1
--package="package" prints users for a package specified.
Output should look like a list of user Linux IDs.
100
101
--list-packages prints the list of packages
Output contains a list of names of packages, like:
package1
package2
package3
Configuring lvectl to use your custom script
Edit /etc/sysconfig/cloudlinux file.
Edit or modify parameter CUSTOM_GETPACKAGE_SCRIPT, and set it to point to your script, like: CUSTOM_GETPACKAGE_SCRIPT=/absolute/path/to/your/script
For the script example please check the following article: https://cloudlinux.zendesk.com/hc/en-us/articles/115004529105-Integrating-LVE-limits-with-packages-for-unsupported-control-panels.
Detecting and working with CloudLinux OS Shared
Detecting if system is running CloudLinux OS Shared/CloudLinux kernel:
uname -r|grep lve
If you get an output, it means the system is running CloudLinux kernel. CloudLinux kernels have lve in its name, like: 2.6.32-458.18.1.lve1.2.44.el6.x86_64
Alternatively you can check for the presence of /proc/lve/list file.
Check if CageFS is enabled (as root ):
/usr/sbin/cagefsctl --cagefs-status
Check if CageFS is enabled for a particular user (as root ):
/usr/sbin/cagefsctl --user-status _USER_NAME_
Check if you are inside CageFS:
Check for the presence of /var/.cagefs/.cagefs.token file - if present, it means that you are inside CageFS.
Displaying CPU, memory & IO limits
Most control panels choose to display CloudLinux OS Shared usage & limits to end customers. To simplify that, we lve-stats exports a file that can be easily read and processed by a control panel to display the necessary information.
The information is located in the /var/lve/info file. This information is updated every 5 minutes, and contains default limits (first line), as well as usage and limits for all customers. If a customer is not present in the file, it means that customer is not active (no scripts were executed recently for the customer), and a customer has default limits (so you can display no usage, and default limits in the control panel for that customer.
The data is stored in a form of one line per customer, with coma separated values.
| 0 | user id |
| 1 | entry processes |
| 2 | entry processes limit |
| 3 | CPU |
| 4 | CPU limit |
| 5 | Virtual Memory |
| 6 | Virtual Memory Limit |
| 7 | Number of virtual memory faults |
| 8 | Number of entry processes faults |
| 9 | Physical Memory Limit |
| 10 | Physical Memory |
| 11 | Number of Physical memory faults |
| 12 | Number of processes limit |
| 13 | Number of processes |
| 14 | Number of processes fault |
| 15 | Reserved |
| 16 | IO Usage |
| 17 | IO Limit |
With LVE version 4 (CloudLinux OS Shared lve0.x) only the first 9 parameters are available. You can check the the version by reading the first byte of /proc/lve/list.
In the version 6 all 15 parameters should be available.
There are only 2 LVE versions currently used in production. Future versions might add more fields, but will not alter order of existing fields.
Memory is defined in 4KB pages (so, 1024 would mean 1024 4KB pages, or 4MB).
IO is defined as KB/s.
CPU is defined as % of total number of cores on a server.
Redis support for HostingLimits
Warning!
Starting from mod_hostinglimits version 1.0-30 Redis is not supported.
Redis support provides a way to query Redis database for LVE id, based on domain in the HTTP request. Given a database like:
xyz.com 10001
bla.com  10002
....
The module will retrieve corresponding LVE id from the database.
To enable Redis support, compile from source: https://repo.cloudlinux.com/cloudlinux/sources/mod_hostinglimits.tar.gz
The compilation requires hiredis library.
wget https://repo.cloudlinux.com/cloudlinux/sources/da/mod_hostinglimits.tar.gz
yum install cmake
tar -zxvf mod_hostinglimits*.tar.gz
cd mod_hostinglimits*
cmake -DREDIS:BOOL=TRUE .
make
make install
To enable Redis mode, specify:
LVEParseMode REDIS
LVERedisSocket
| Description | Socket to use to connect to Redis database. |
| Syntax | LVERedisSocket path |
| Default | /tmp/redis.sock |
| Context | server config |
Used to specify location of Redis socket.
Example:
LVERedisSocket /var/run/redis.sock
LVERedisAddr
| Description | IP/port used to connect to Redis database instead of socket. |
| Syntax | LVERedisAddr IP PORT |
| Default | none |
| Context | server config |
Used to specify IP and port to connect to Redis instead of using Socket
Example:
LVERedisAddr 127.0.0.1 6993
LVERedisTimeout
| Descriptin | Number of seconds to wait before attempting to re-connect to Redis. |
| Syntax | LERetryAfter SECONDS |
| Default | 60 seconds |
| Context | server config |
Number of seconds to wait before attempting to reconnect to Redis after the last unsuccessful attempt to connect.
Example:
LVERedisTimeout 120
Migration to EA4
- Advices and limitations
- CentOS with EasyApache 4
- CentOS without EasyApache 4
- CloudLinux OS Shared without EasyApache 4
- More about cloudlinux_ea3_to_ea4 script
Advices and limitations
- Use cPanel 11.55.999.66(55.999.66) or higher version.
- Hardened EA4 limitations:
- ea-php51 and ea-php52 have no PHP-FPM support. Please use mod_lsapi instead.
Follow the instructions here to install and configure mod_lsapi.
CentOS with EasyApache 4
If EasyApache 4 was installed earlier on your CentOS server and you would like to migrate to CloudLinux OS Shared:
Convert server from CentOS to CloudLinux (see these instructions).
Restart Apache service.
CentOS without EasyApache 4
If EasyApache 4 was not installed earlier on your CentOS server and you would like to migrate to CloudLinux OS Shared:
Convert server from CentOS to CloudLinux OS Shared (see these instructions).
Run:
cd ~; wget https://repo.cloudlinux.com/cloudlinux/sources/cloudlinux_ea3_to_ea4; sh cloudlinux_ea3_to_ea4 --convert
(Find examples of cloudlinux_ea3_to_ea4 script usage below).
CloudLinux OS Shared without EasyApache 4
Install EasyApache4 on clean CloudLinux OS Shared from ISO image or migrate to EasyApache4 on existings CloudLinux OS Shared servers:
- Install cPanel.
- Run:
cd ~; wget https://repo.cloudlinux.com/cloudlinux/sources/cloudlinux_ea3_to_ea4; sh cloudlinux_ea3_to_ea4 --convert
(Find examples of cloudlinux_ea3_to_ea4 script usage below).
More about cloudlinux_ea3_to_ea4 script
About cloudlinux_ea3_to_ea4 migration script parameters:
cloudlinux_ea3_to_ea4 [ADDITIONS] ACTIONS
Usage:
| -h, --help | Print this message |
Actions (required parameter, shows what should script do):
| -c, --convert | Convert EA3 to EA4 |
| -r, --revert | Revert to EA3 |
Additions (optional parameter, adds to action installation of extra components):
| -m, --mod_lsapi | Install mod_lsapi |
| -p, --mod_passenger | Install alt-mod-passenger |
| -a, --altphp | Install/Update alt-php |
Examples:
- If you want to install EA4 with mod_lsapi and update/install alt-php:
sh cloudlinux_ea3_to_ea4 --convert --mod_lsapi --altphp
- If you want to install EA4 with mod_lsapi, alt_mod_passenger and update/install alt-php:
sh cloudlinux_ea3_to_ea4 --convert --mod_lsapi --altphp --mod_passenger
- To restore EA3 with mod_lsapi:
sh cloudlinux_ea3_to_ea4 --revert --mod_lsapi
See also: FAQ