CloudLinux Manager UI
CloudLinux Manager is a plugin for most popular control panels including cPanel, Plesk, DirectAdmin, InterWorx, and CyberPanel. It allows you to control and monitor limits, and set limits on per package bases.
CloudLinux Manager is installed by default on most servers. If it is missing you can always install it by running:
yum install lvemanager
Installation wizard
Overview
CloudLinux OS Shared Installation Wizard allows you to easily install and set up CloudLinux OS components on your server with cPanel, Plesk or DirectAdmin.
Set up
As you have CloudLinux OS Shared installed, navigate to CloudLinux OS Shared CloudLinux Manager in your control panel. CloudLinux OS Shared Installation Wizard starts automatically if lvemanager package is installed for the first time (not updated).
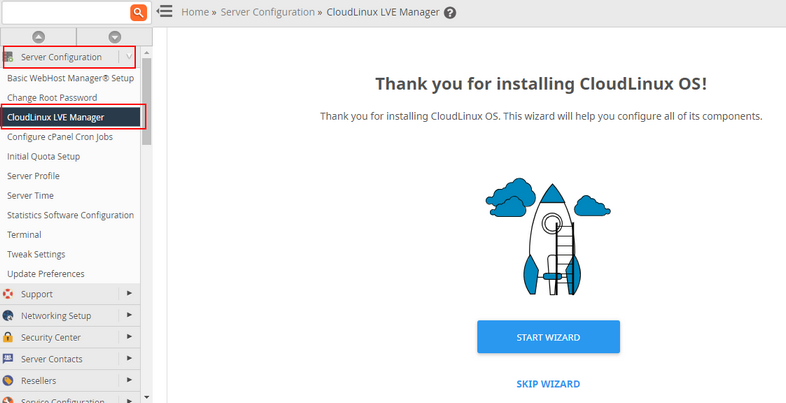
To start setting up your CloudLinux OS Shared, click Start Wizard, otherwise click Skip Wizard, and you will be redirected to the CloudLinux Manager Dashboard.
Note
Installation statuses of all components are duplicated inside their corresponding boxes on the Dashboard. All Wizard actions are available there as well. Dashboard will be automatically updated as soon as the installation process finishes.
The next step is selecting required components to be installed. 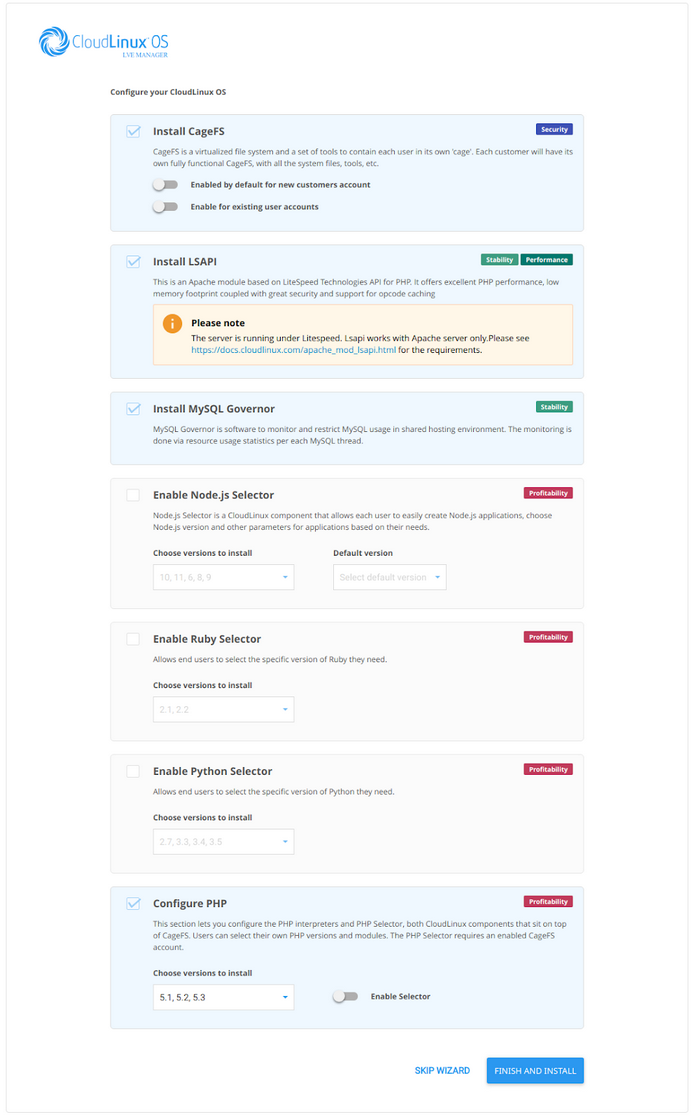
Click Finish and Install to complete installation or click Skip Wizard to go back to the Dashboard.
You can find a complete description of the CloudLinux OS components below.
CloudLinux OS components
CageFS
A virtualized per-user file system encapsulates each customer into a ‘cage’ preventing them from seeing each other files and viewing sensitive information (e.g., system files)
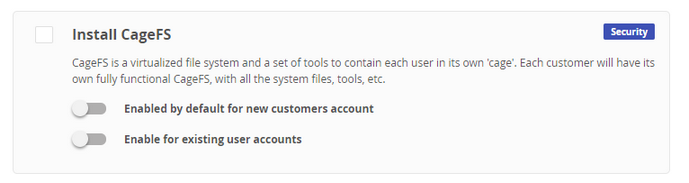
Toggle the sliders to enable CageFS by default for new and/or existing users.
Note
CageFS is a requirement for PHP Selector operation.
LSAPI
It is the fastest and most reliable way to serve PHP pages for Apache web-servers, a drop-in replacement for SuPHP, FCGID, RUID2, and ITK.
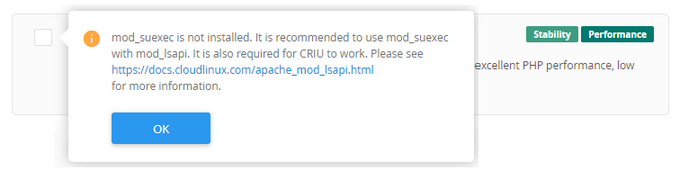
LSAPI requires CRIU to operate and we also recommend you to use mod_suexec. You can find details in our documentation.
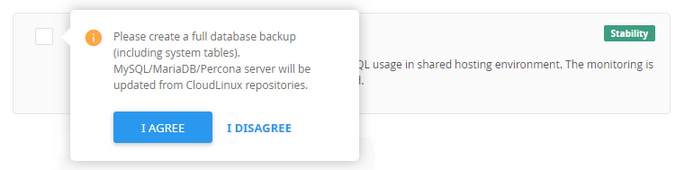
MySQL Governor
Monitors MySQL usage to throttle abusers, preventing server overload and improving overall performance.
Note
MySQL Governor can be automatically installed only with cPanel/WHM and DirectAdmin - use CLI instructions available here in all other cases.
We recommend you to create a full database backup before the MySQL Governor installation.
Node.js Selector
Allows end users to create Node.js applications and select the specific version of Node.js and other parameters.
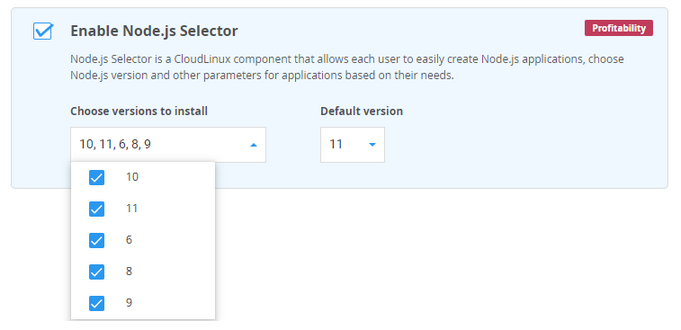
Here you can choose versions to be installed and the version to be used as default.
Ruby Selector
Allows end users to select the specific version of Ruby they need. 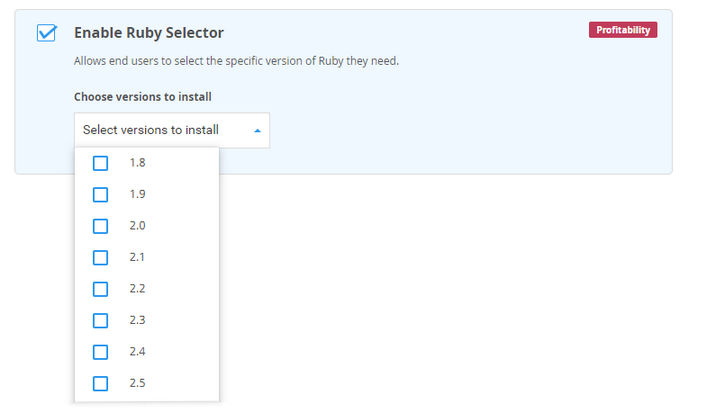
Here you can choose Ruby versions to be installed.
Python Selector
Allows end users to select the default version of Python and set the required versions for installation.
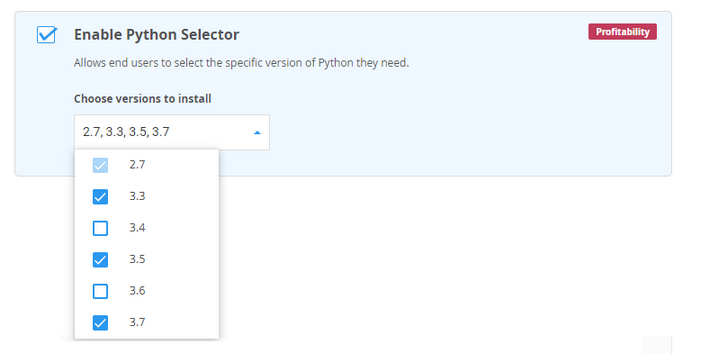
Here you can choose Python versions to be installed.
PHP Selector
Allows end users to select the specific version of PHP they need, with over 120 PHP extensions to choose from.
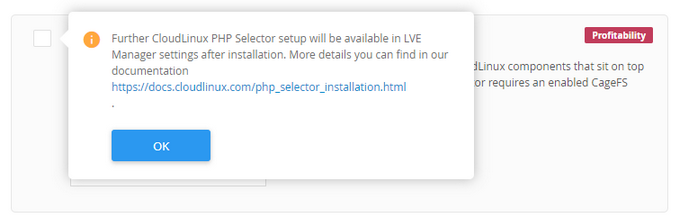
Go to CloudLinux Manager settings to set up PHP Selector options and parameters. Read more in the PHP Selector documentation.
Note
CageFS should be enabled for PHP Selector to operate.
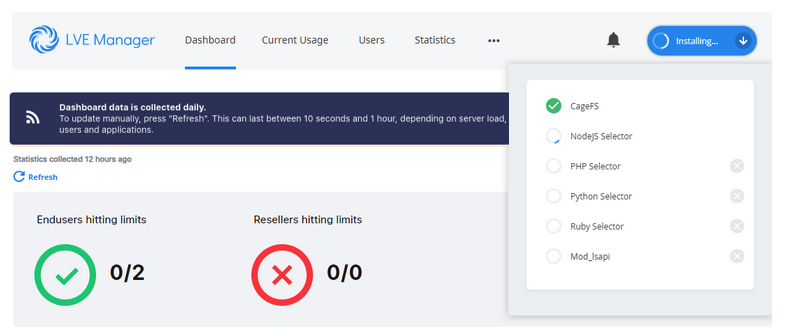
When the components to be installed are selected and configured, and installation is started, you will be redirected to the CloudLinux Manager | Dashboard.
Installation process and possible errors
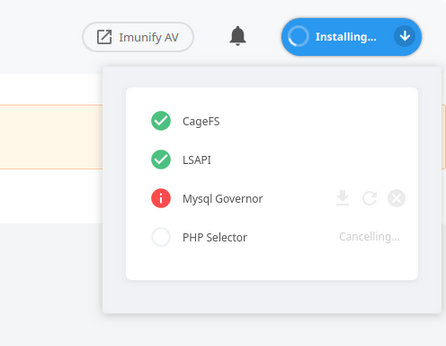
Installation status is displayed throughout the process in the Dashboard. Click Installing to show modules installation state.
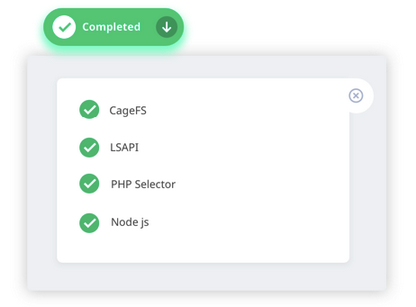
All installed modules are displayed on the Dashboard. When installation is completed successfully, you will see the following status.
If you decide to remove failed module or a module to be installed by clicking the (X) button, a confirmation dialog will appear.
After confirming the action, the module will disappear from the list.
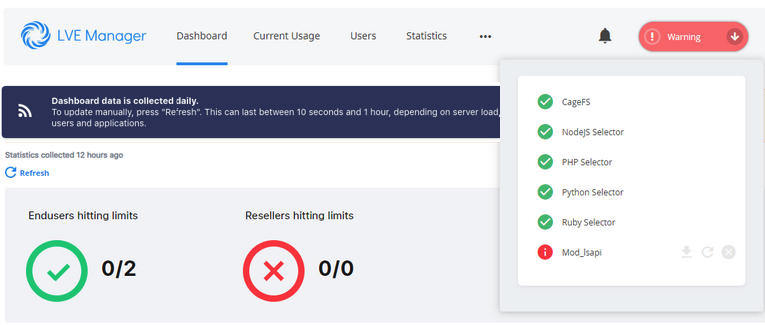
If module installation fails, the Installing button changes to Warning and the module indicator will turn red.
- Click
 to download the error log.
 - Click
 to try to install a module again.
 - Click
 to remove a specific module from the installation queue. The module will be displayed on the Dashboard but will not be installed.
If module auto-installation fails, you will see that the module indicator turns yellow.
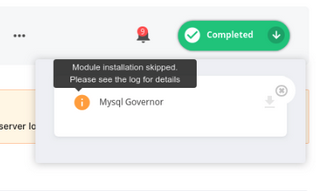
In this case, you can download a log for details and try to install the module again.
Wizard fatal error
In case of a fatal error, you will see the following warning.
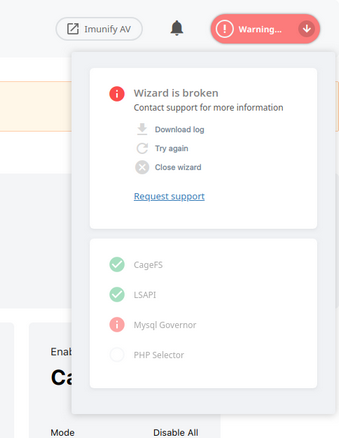
- Click to download the error log.
- Click to try to install module(s) again.
- Click to cancel installation. The canceled modules will be removed from the installation process.
You can contact our support team for further assistance anytime by submitting a ticket in our helpdesk system.
CloudLinux Manager
cPanel CloudLinux Manager administrator interface allows monitoring and managing limits for hosts end users, managing packages and monitoring statistics.
Administrator credentials allow controlling limits for host users.
Log in as administrator to get access to the following functionality:
- Dashboard provides a quick overview of statistics and all administrative information for server administrators.
- Current usage tab - allows monitoring users resource usage at the moment;
- Users tab with the list of all users allows viewing and managing all the users limits;
- Statistics tab displays the statistics of resource usage for proper timeframe or proper users;
- Options tab - allows setting LVE Faults email notifications for users;
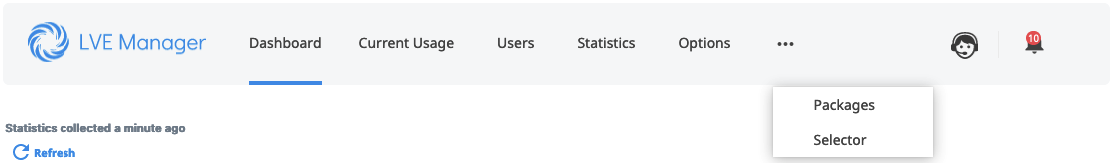
- Packages allows managing packages limits;
- PHP Selector tab.
For more details, please go to the ImunifyAV documentation.
Notifications color codes
In the CloudLinux Manager UI we use the following color codes for notifications:
 warning
 error
error information
 success
The following actions are available in the action notifications (error, success)
- follow a link
- copy a command
- copy a whole traceback
The following actions are available in the system notifications (information, warning):
- follow a link
- copy a command
- copy a whole message
- mark a notification as “Read”
- snooze a notification
Dashboard
Note
Available starting from CloudLinux Manager 4.0-26.8
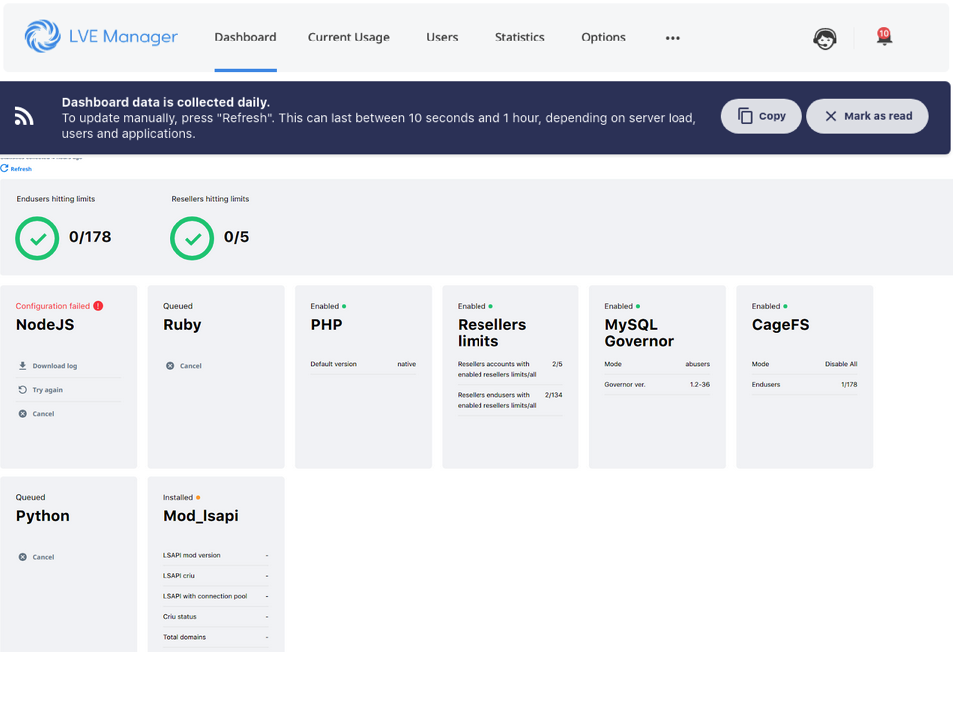
CloudLinux OS Shared dashboard provides a quick overview of statistics and all administrative information for server administrators.
Go to CloudLinux Manager | Dashboard.
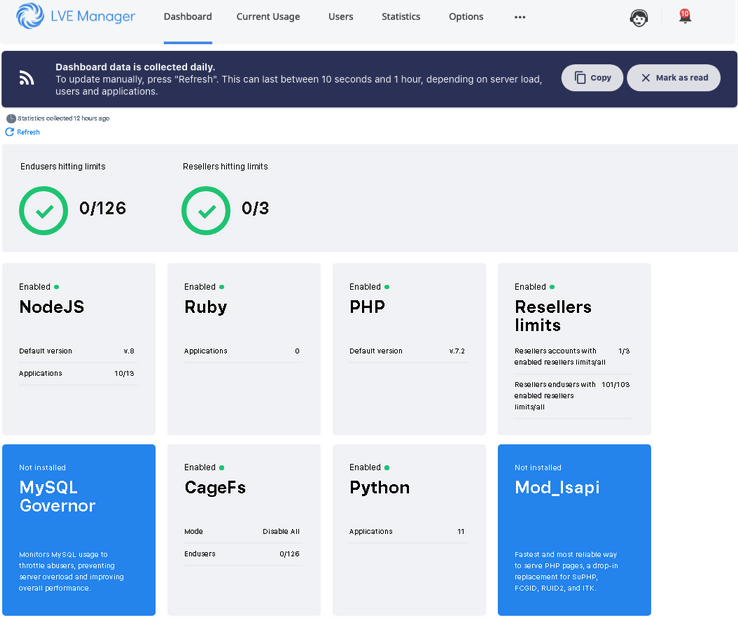
The CloudLinux OS Shared Dashboard provides the following information:
- End Users hitting limits — number of users reaching their limit in any kind of resource. Data is within the last 24 hours.
- Resellers hitting limits — number of enrolled Resellers that are reaching their limit in any kind of resource. Data is within the last 24 hours.
- Node.js Selector block displays the following data:
Node.js Selector status (Enabled/Disabled/Not installed) — displays a current status of the Node.js Selector.
To manage Node.js Selector, click Manage. You will be redirected to LVE Manager | Options | Node.js Selector.
Click Install to install Node.js Selector, you will be redirected to CloudLinux Manager | Options | Node.js.Selector.
Default version — the current default version of Node.js set in your system. Click Manage to change the default version account wide.
Applications — number of installed/all applications for the account.
- Ruby Selector block displays the following data:
Ruby Selector status (Enabled/Disabled/Not installed) — displays a current status of the Ruby Selector.
To manage Ruby Selector, click Manage. You will be redirected to CloudLinux Manager | Options | Ruby Selector.
Click Install to install Ruby Selector, you will be redirected to CloudLinux Manager | Options | Ruby Selector.
Applications — number of installed/all applications for the account.
- PHP Selector block displays the following data:
- Default version — the default version of PHP binaries. Click Manage to change the default version, enable or disable PHP Selector, change the list of supported versions, and choose default modules. You will be redirected to CloudLinux Manager | PHP Selector.
PHP Selector (cPanel) has malfunctions warnings about the most common issues.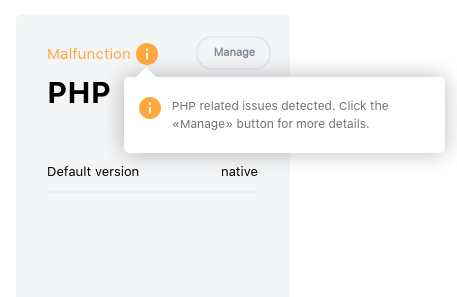
- Default version — the default version of PHP binaries. Click Manage to change the default version, enable or disable PHP Selector, change the list of supported versions, and choose default modules. You will be redirected to CloudLinux Manager | PHP Selector.
- Python Selector block displays the following data:
Python Selector status (Enabled/Disabled/Not installed — displays a current status of the Python Selector.
To manage Python Selector, click Manage. You will be redirected to CloudLinux Manager | Options | Python Selector.
Click Install to install Python Selector, you will be redirected to CloudLinux Manager | Options | Python Selector.
Applications — number of installed/all applications for the account.
- Reseller Limits block displays the following data:
- Reseller Limits status (Enabled/Disabled). To manage Reseller Limits, click Manage. You will be redirected to CloudLinux Manager | Users tab.
- Reseller’s accounts with Reseller Limits/all — the number of Reseller accounts with Reseller Limits enabled versus the total number of Reseller accounts.
- Reseller’s End Users with enabled Reseller Limits/all — the number of end users with Reseller Limits enabled versus all End Users that belong to all resellers.
- MySQL Governor block displays the following data:
- MySQL Governor status (Enabled/Disabled/Not installed/Skipped). To manage MySQL Governor, click Manage. You will be redirected to CloudLinux Manager | Options | MySQL Governor Mode of Operation. Click Install to install MySQL Governor.
- Mode — displays the MySQL Governor mode of operation. Click Manage to change the mode.
- Single — single LVE is used for all customers that go over their DB limits (deprecated).
- Off — monitor Only, no DB query limits are applied.
- All — all queries are run inside user's LVE.
- Abusers — only queries that go over DB limits are executed inside that user's LVE (this is the default mode).
- Database version — displays a current version of MySQL/MariaDB/Percona server installed in the system.
- CageFS block displays the following data:
- CageFS status (Enabled/Disabled/Not installed). To manage CageFS, click Manage. You will be redirected to CloudLinux Manager | Options | CageFS. Click Install to install CageFS.
- Mode displays the current CageFS mode of operation.
- End users — displays the number of users with CageFS enabled/all.
- ModLSAPI block displays the following data:
- Mod_lsapi status (Enabled/Disabled/Not installed). Click Install to install Mod_lsapi.
- Module version displays the running version of Mod_lsapi.
- Criu_status displays the status of lsapi_criu:
- Running — means that lsapi_criu is working.
- Stopped — means that lsapi_criu is not working.
- Total Domains displays the total number of domains with Mod_lsapi configured as PHP handler.
- Criu_version displays the running version of lsapi_criu.
- LSAPI with connection pool.
Note
- If statistics for server is absent for any reasons, you can update it by pressing the Refresh button. This process can last from 10 seconds to one hour depending on your server's performance, number of users and applications.
- If statistics collection is turned off it is not displayed. If you wish to get daily statistics for your server, please turn it on by adding
cl_statistics_enabled=1parameter to the/etc/sysconfig/cloudlinuxfile. - Data for the Dashboard is collected once per day. If you want to update data manually, press Refresh. This process can last from 10 seconds to one hour depending on your server's performance, number of users and applications.
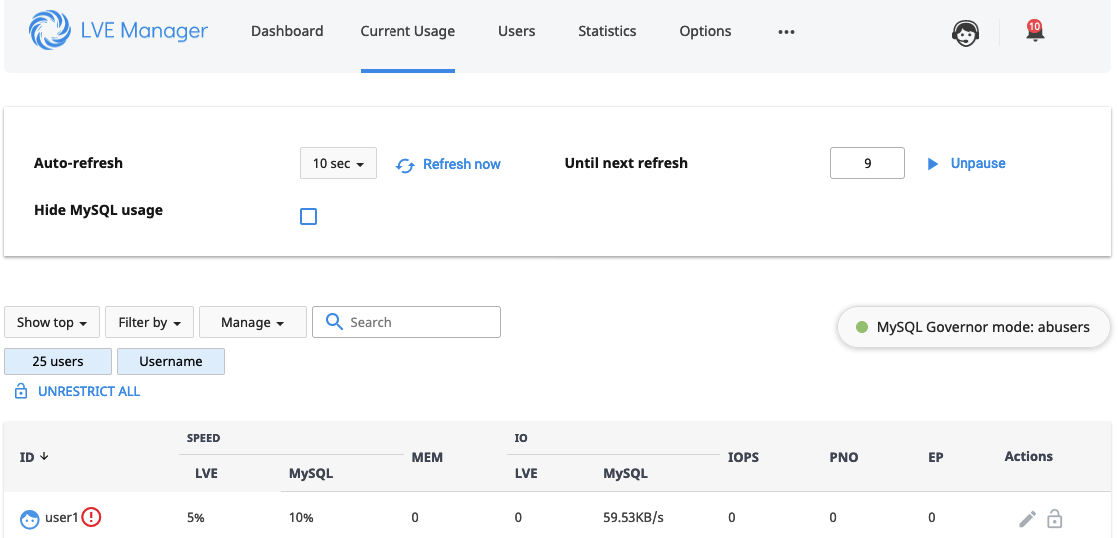
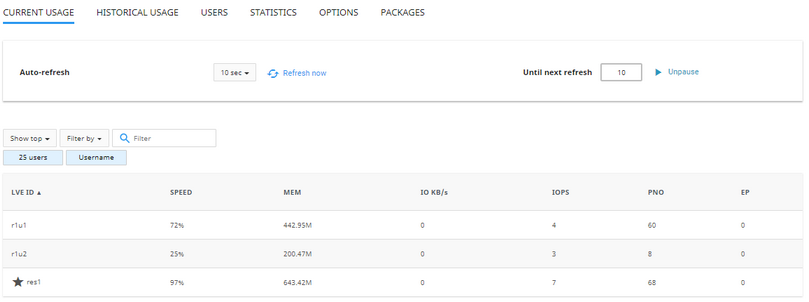
Current usage
Choose Current usage tab to monitor users resource usage at the moment displayed in the table.
Current usage table provides the information on the usage of Speed, memory, IO, IOPS, Number of Processes, and Entry Processes.
Resource usage values are being refreshed every 10 seconds which is set in Auto-refresh field. You can refresh the table manually by clicking Refresh now or you can freeze the values by clicking pause button. Usage values will not change until the next manual refresh.
Tick Hide MySQL usage checkbox to hide the information on MySQL usage.
To expand the list of users click on the number above and in the dropdown choose the number of user to be displayed on the page.
The list of users can be filtered by Username and Domain.
Hoster can view all types of users:
- End users
- Resellers
- Reseller’s end users
- Reseller’s end users (no Reseller limit).
But hoster can only manage:
- End users
- Resellers
- Reseller’s end users (no Reseller limit)
To manage Reseller’s end users hoster should login as a reseller.
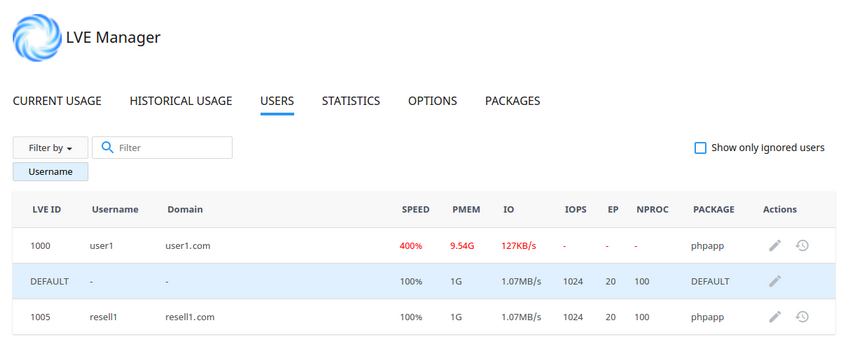
Users
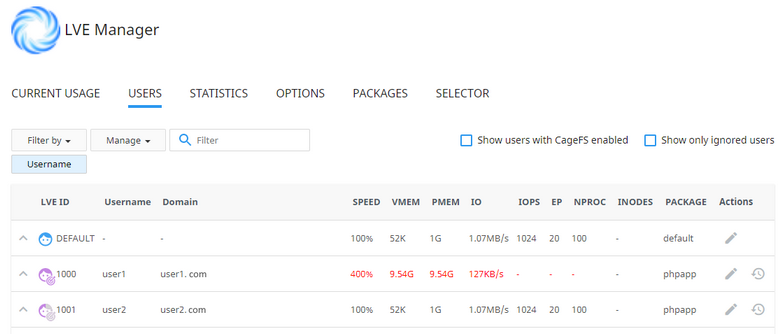
Choose Users tab to view the list of all users in the system and manage their limits.
Note
A hoster can view the list of resellers’ end users and their limits, but can not manage resellers’ end users limits (if those are set by reseller).
- Tick Show users with CageFS enabled to show users with CageFS file system enabled.
- Tick Show only ignored users to show users with ignored MySQL Governor.
The following filters are available:
- Manage by
- End users
- Resellers
- Reseller's end users
- Reseller's end users (no Reseller limit)
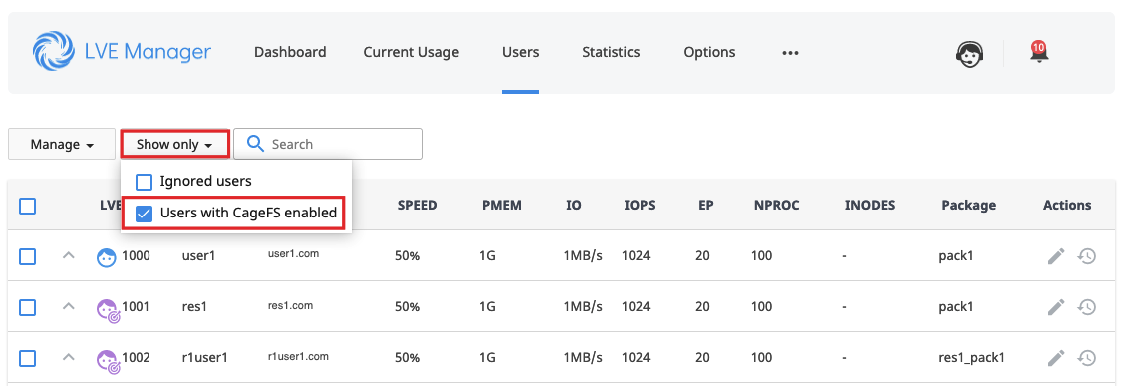
- Show only
- Ignored users - show users with ignored MySQL Governor.
- Users with CageFS enabled
Also, you can search user by his Username, domain or LVE ID in the Search field.
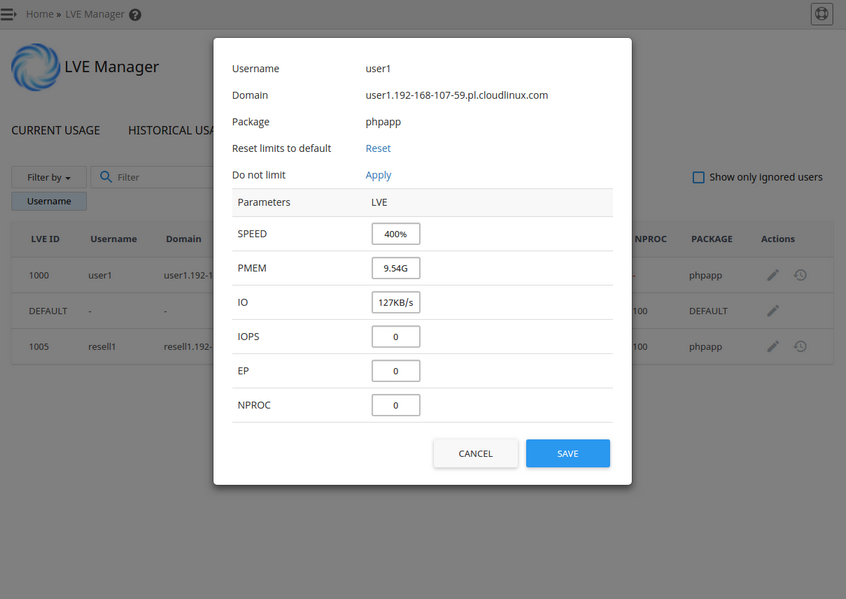
Actions
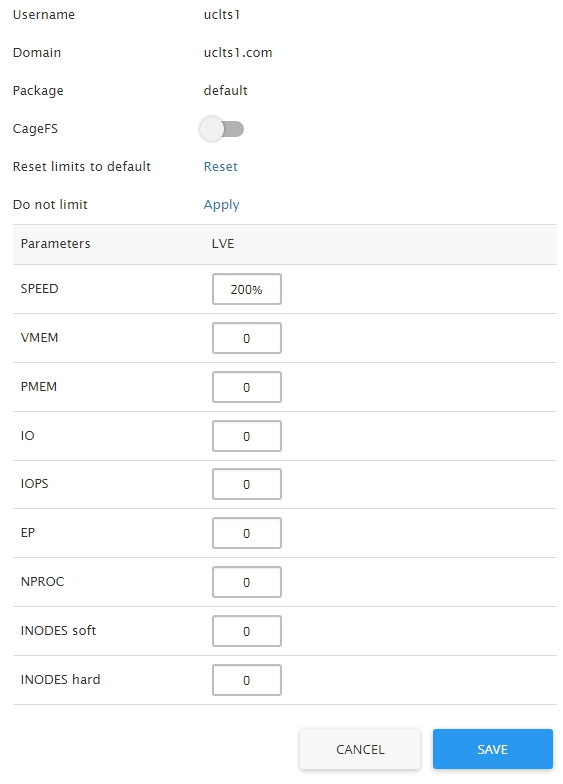
Click pencil icon in Actions column to edit limits for a particular user. The following actions are available:
- Enable/disable CageFS
- Reset - to reset limits to default values
- Apply Do not limit to set the limits to unlimited;
- Setting the limits values:
- SPEED
- SPEED MYSQL
- VMEM
- PMEM
- IO
- MySQL IO
- IOPS
- EP
- NPROC
- INODES (hard and soft) (for end users and resellers’ end users (with no Reseller Limits), if a hoster has enabled Initial quotas in cPanel settings).
Click Save to save changes or Cancel to close the pop-up.
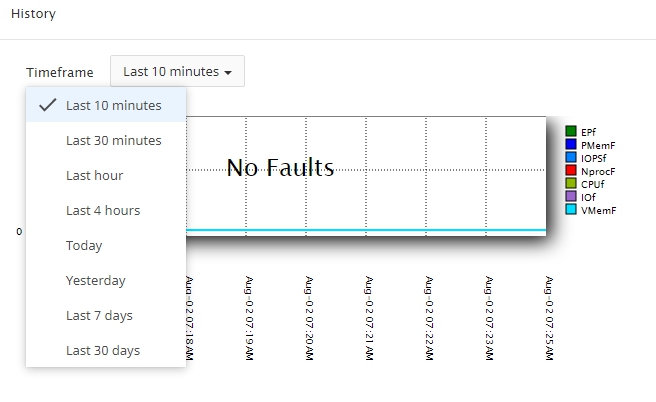
Click on History symbol to view the history of a particular user resource usage. Choose time frame to view the history for a particular time period.
Group actions for users with enabled CageFS
Note
If CageFS is disabled, group actions are not available. See how you can enable CageFS:
- Managing users
- CageFS CLI
- via cPanel CageFS User Manager plugin.
View users with enabled CageFS
To view users with enabled CageFS, click Show only >> Users with CageFS enabled
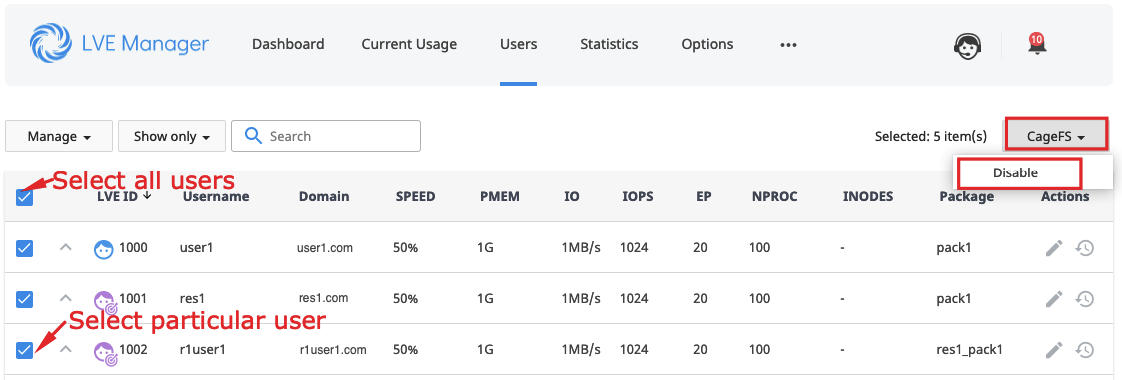
Disable CageFS for several users
To disable CageFS for several users, do the following.
- Select a particular user or select all users
- Click CageFS >> Disable.
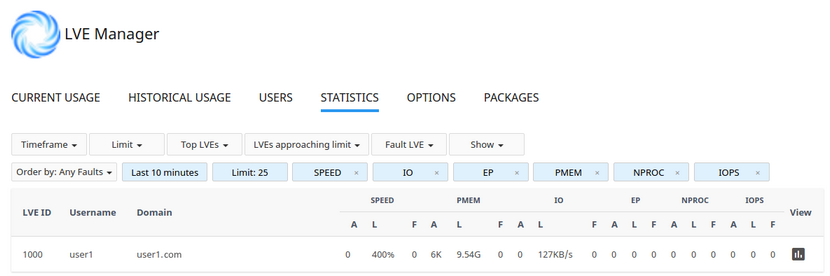
Statistics
Choose Statistics tab to view end users, resellers and resellers’ end users limits usage statistics.
The following parameters can be displayed in the statistics table:
- SPEED usage per user;
- IO usage per user;
- EP usage per user;
- VMEM usage per user;
- PMEM usage per user;
- NPROC usage per user;
- IOPS usage per user;
- MySQL usage per user.
Click Show and select columns from the drop-down to set which parameters should be displayed in the table.
Statistics table can be filtered by:
- Timeframe - to view the statistics for a particular period;
- Limit - to view a particular limit type usage only;
- Top LVEs - to view top used limits only;
- LVE approaching limit - to view the limits that are approaching maximum provided value;
- Fault LVE - the limits that have reached the maximum value.
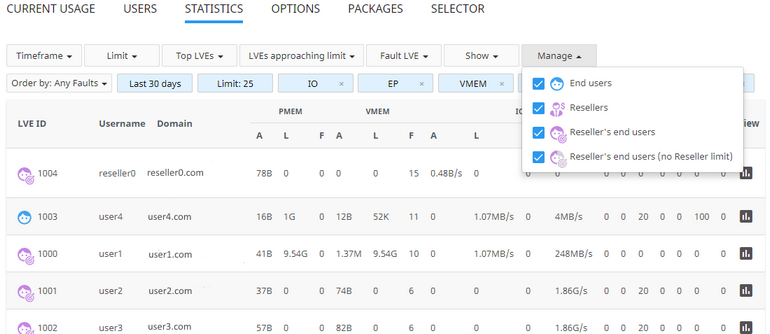
Click Manage to choose type of users to be displayed - End users, Resellers, Resellers’ end users or Resellers’ end users (no Reseller limit) by ticking checkbox in the drop-down.
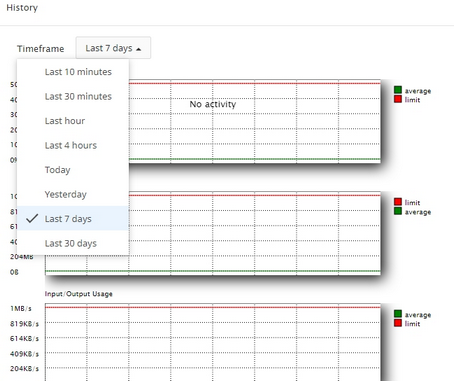
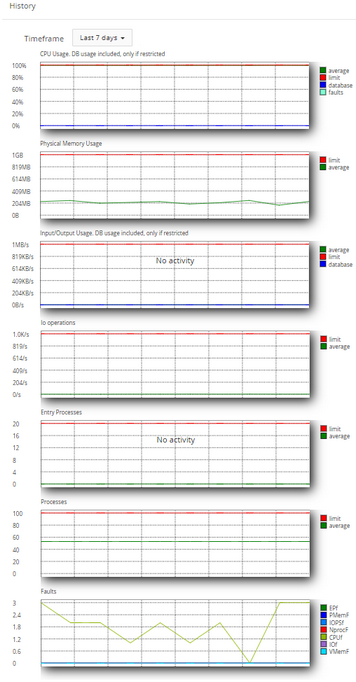
Click chart symbol in the View column to view the detailed resource usage history for a particular account. Use timeframe drop-down to view the history for a particular period of time.
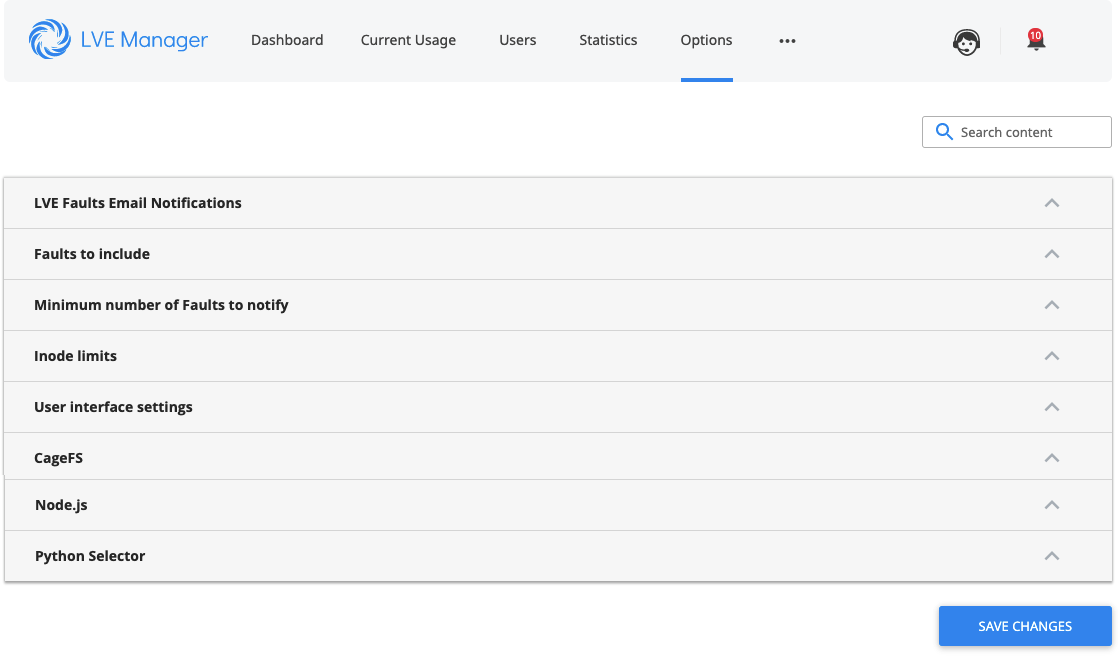
Options
The following sections are available to set the required options:
- LVE Faults Email Notifications - allows to set the required type of notification
- Faults to include - allows to include required limits to the notifications
- Minimum number of Faults to notify - allows to set a number of faults required for the notification to be sent for hoster, reseller, and user
- Inode limits - allows to manage inode limits
- User interface settings - allows to manage user interface settings
- MySQL Governor settings - allows to manage MySQL Governor settings (if MySQL Governor is installed)
- CageFS - allows to manage CageFS settings
- Node.js - allows to enable/disable and manage Node.js Selector
- Python Selector - allows to enable/disable and manage Python Selector
LVE Faults Email Notifications
Starting from CloudLinux Manager v.7.3.0-1 and LVE-Stats v.4.1.4-1 users can disable in their Resource Usage plugin email notifications about hitting LVE limits by themselves.
To allow users to do so, the administrator should enable the Notify Customers and Notify Reseller’s Customers options.
Unfortunately, it is not possible to disable LVE Faults Email Notifications for all users by default so that users can enable the feature themselves in their interface.
But it is possible to enable LVE Faults Email Notifications for all users by default, so that users can disable the feature themselves in their interface.
A hoster can set email notifications for panel administrator, reseller customer, and resellers’ customers in cases of limits faults. Choose Options tab to manage LVE Faults email notifications.
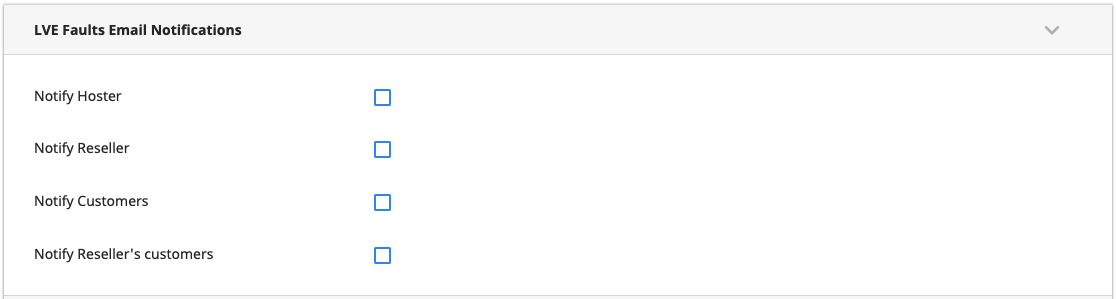
The following types of notification are available:
- Notify Hoster - receive notifications on users and its own LVE faults
- Notify Reseller - allows reseller receiving notifications on their user's LVE faults
- Notify Customers - allow host's users receiving notifications on their LVE faults
- Notify Reseller's customers - allows resller's users receiving notifications on their LVE faults
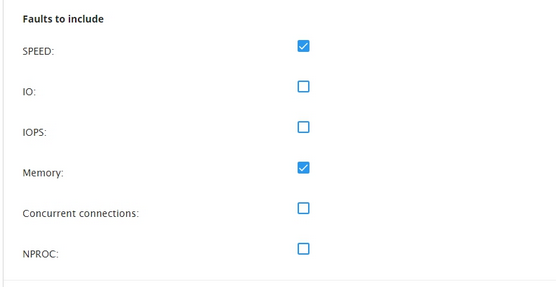
Faults to include
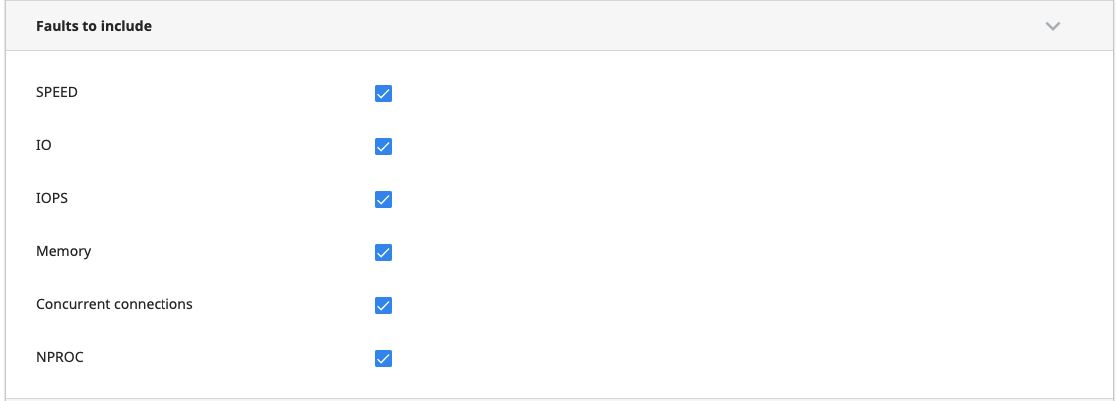
Tick checkboxes to include required limits to the notifications:
- SPEED - include SPEED limit fault to the notification
- IO - include I/O limit fault info to the notification
- IOPS - include IOPS limit fault info to the notification
- Memory - include Memory limit fault info to the notification
- Concurrent connections - include concurrent connections limit fault info to the notification
- NPROC - include NPROC limit fault info to the notification.
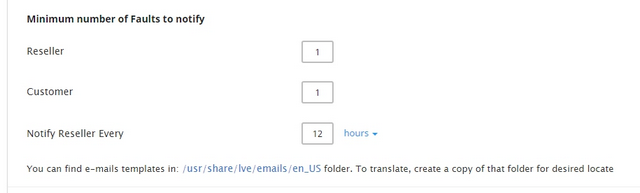
Minimum number of Faults to notify
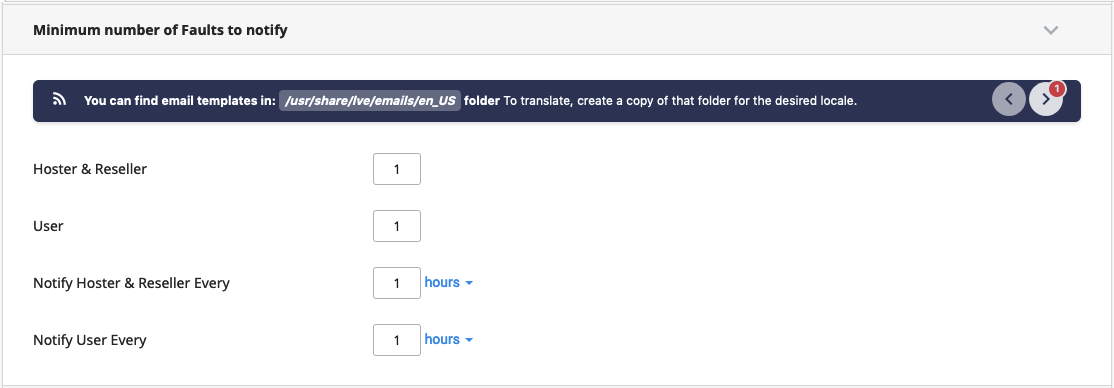
Set a number of faults required for the notification to be sent for:
- Hoster and Reseller
- User
Set the frequency of email notifications sending to:
- Hoster and Reseller
- User
Inode limits
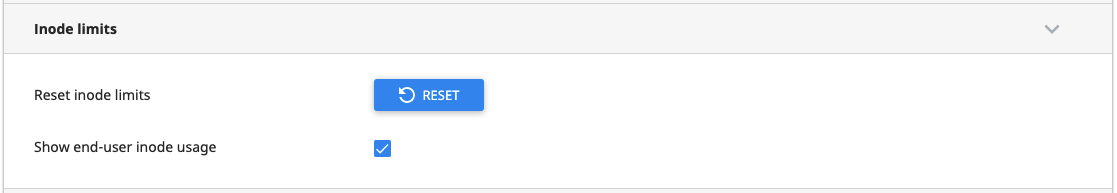
Allows to reset inode limits and show/hide end-user inode usage.
User interface settings
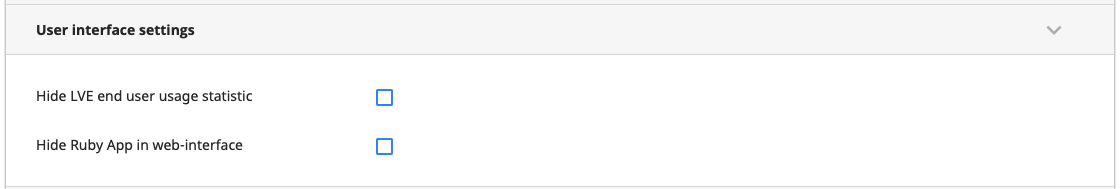
Allows to manage user interface settings:
- Hide LVE end user usage statistic - a user will not be able to see his usage statistic in his web interface
- Hide Ruby App in web-interface - a user will not be able to see Ruby Selector in his web interface
MySQL Governor settings
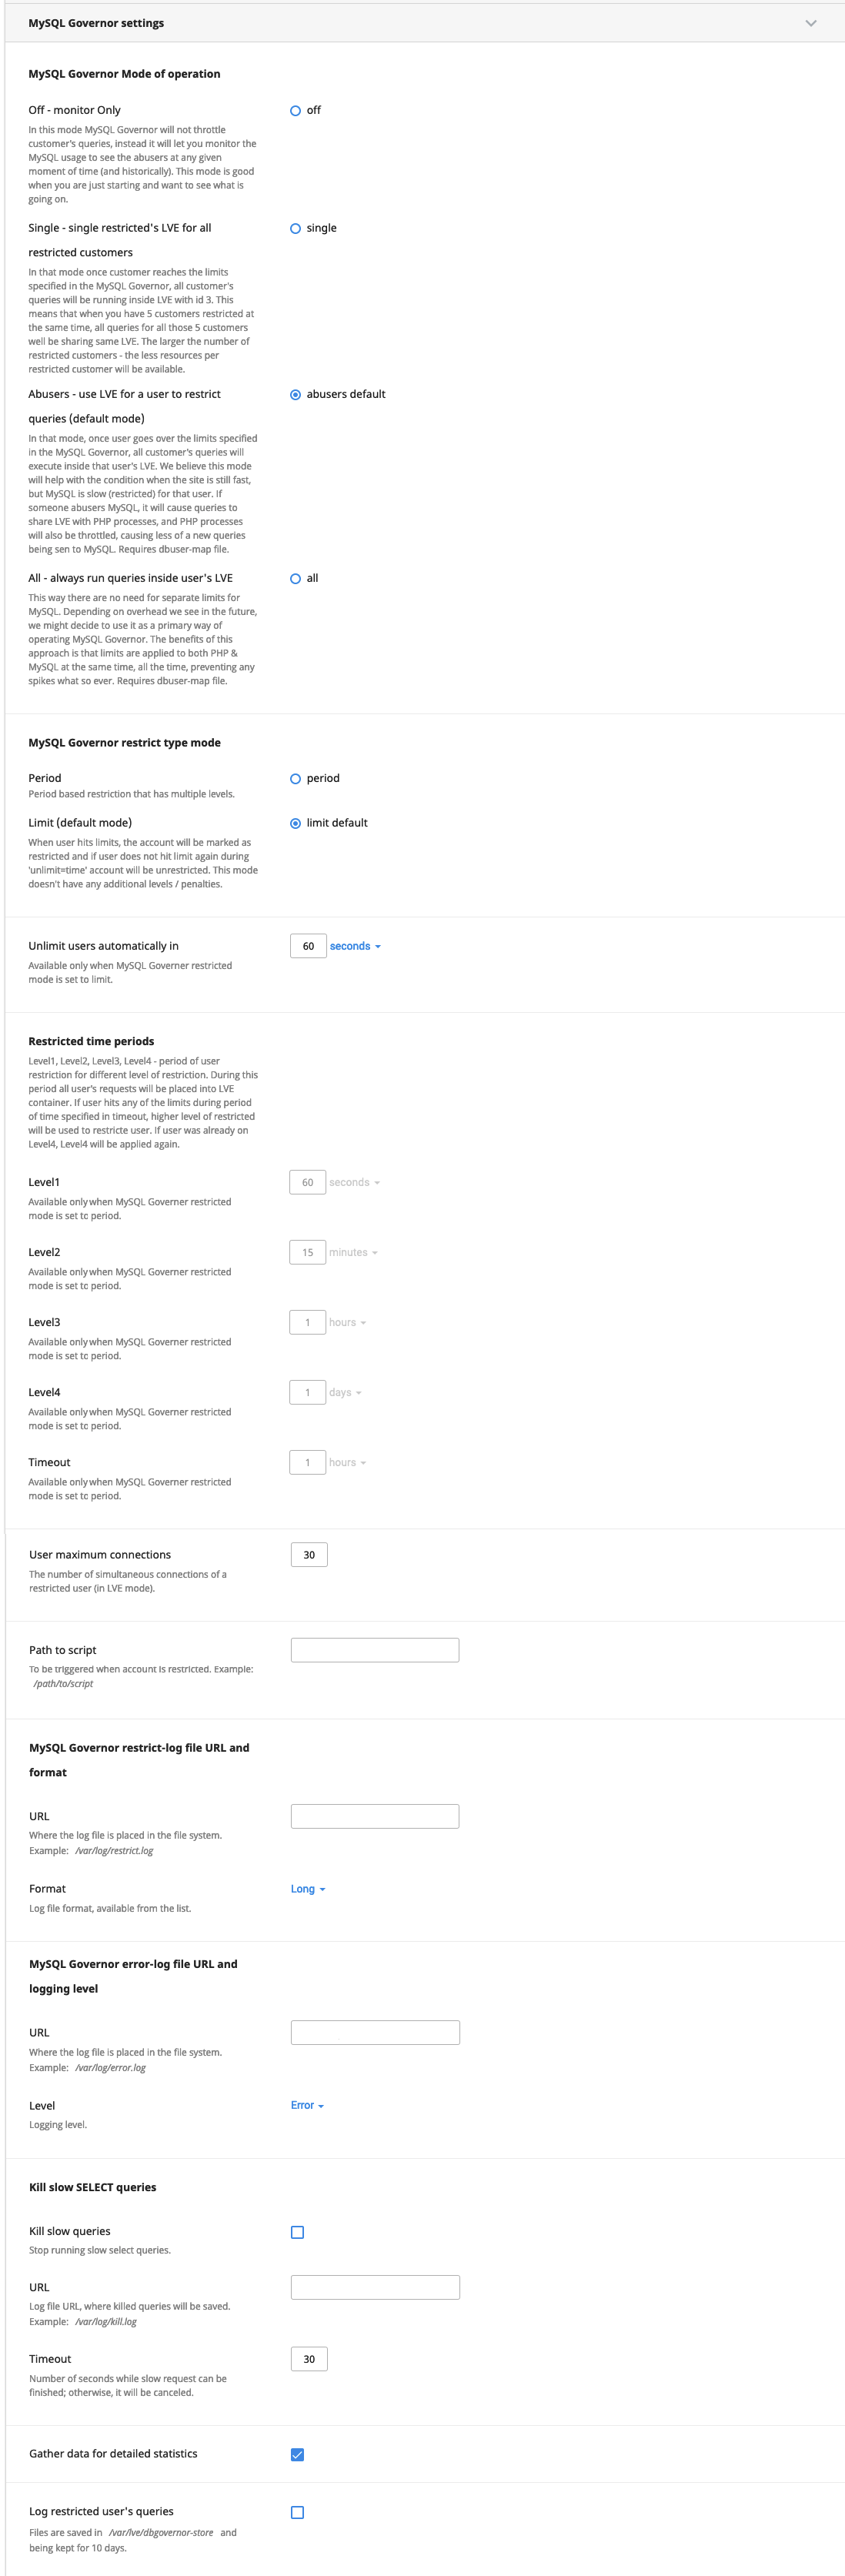
Allows to manage MySQL Governor settings.
MySQL Governor Mode of operation
- Off - monitor Only – not throttle customer's queries, only monitor MySQL usage.
- Single - single restricted LVE for all restricted customers – all queries for all restricted customers well be sharing the same LVE.
- Abusers - use LVE for a user to restrict queries (default mode) – if a user goes over the limits, all his queries will execute inside his LVE.
- All - always run queries inside user's LVE – limits are applied to both PHP & MySQL queries at the same time.
MySQL Governor restrict type mode
- Period – allows to restrict users for a specified time period
- Limit (default mode) – allows to restrict/automatically unrestrict users that hit limits/don't hit limits during 'unlimit=time'
Unlimit users automatically in
Allows to unlimit users automatically if they don't hit the limits during the specified number of seconds/minutes/hours/days.
Restricted time periods
User restriction time period for different levels of restriction and the timeout to apply a higher restriction level.
- Level1
- Level2
- Level3
- Level4
- Timeout
User maximum connections
The number of simultaneous connections of a restricted user (in the LVE mode).
Path to script
To be triggered when account is restricted.
MySQL Governor restrict-log file URL and format
- URL – where the log file is placed in the file system
- Format – log file format: short, medium, long, very long
MySQL Governor error-log file URL and logging level
- URL – where the log file is placed in the file system
- Level – logging level: error, debug
Kill slow SELECT queries
- Kill slow queries – stop running slow select queries
- URL – log file URL, where killed queries will be saved
- Timeout – number of seconds while slow request can be finished, otherwise, it will be canceled
Gather data for detailed statistics
Tick if yes.
Log restricted user's queries
Tick if yes.
CageFS
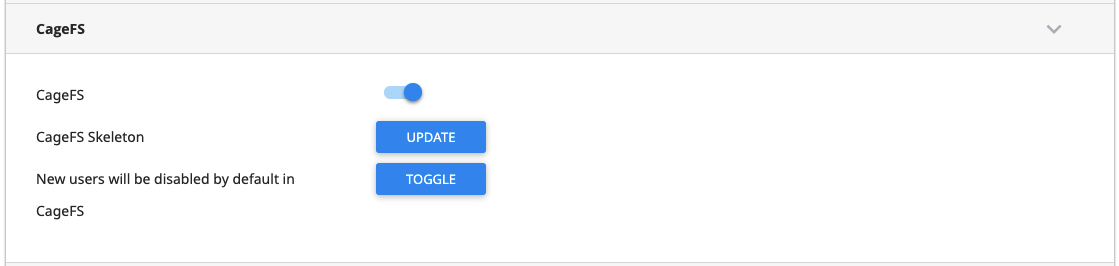
Allows to manage CageFS settings:
- CageFS - enable/disable CageFS
- CageFS Skeleton - click to update CageFS skeleton. See: Updating CageFS skeleton
- New users will be disabled by default in CageFS - toggle to enable/disable new users in CageFS by default.
Node.js
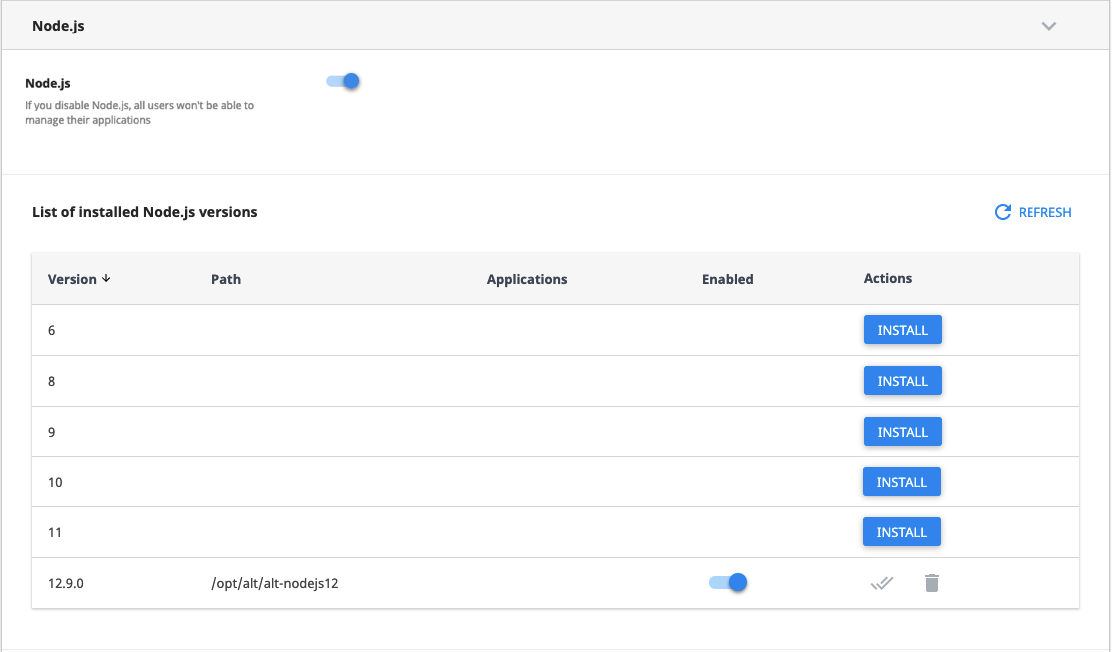
Allows to enable/disable and manage Node.js Selector.
See more:
Python Selector section
Allows to enable/disable and manage Python Selector.
See more:
When you've done with settings, click Save Changes to apply changes.
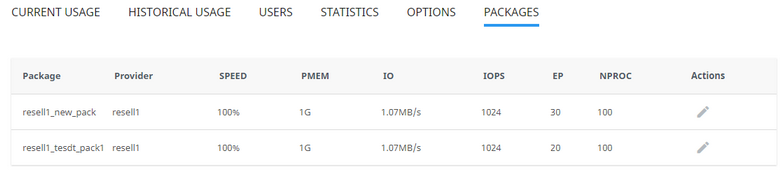
Packages
Packages tab allows setting the limits for as many users as you need by editing packages of proper limits. Each account belonging to a proper package adheres to those limits.
Note
Limits from the package will not be applied if the package’s owner differs from the owner of the account you’re trying to apply limits to. Default limits will be applied instead.
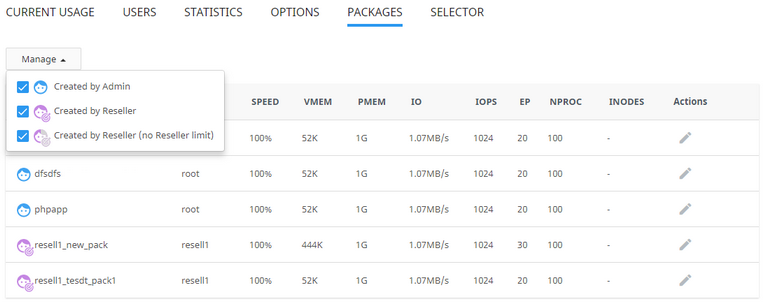
Choose Packages tab to view and modify:
- limits for user packages (created by hoster);
- limits for reseller packages (created by hoster);
- limits for resellers’ end users packages if reseller limits are not set for that reseller (hoster access allows identifying a particular reseller’s end user belonging to a particular reseller (created by reseller)).
To modify package limits click on a pencil symbol in Actions column in a particular package row. The following limits for this package are available for setting:
- SPEED in percent (%);
- Virtual memory (VMEM) (can be set as unlimited by setting 0);
- Physical memory (PMEM) (can be set as unlimited by setting 0);
- I/O limits (IO) (can be set as unlimited by setting 0);
- IOPS limits;
- Concurrent connections (EP);
- Number of processes (NPROC) (can be set as unlimited by setting 0);
- INODES (hard and soft) (for end users and resellers’ end users (with no Reseller Limits), if a hoster has enabled Initial quotas in cPanel settings.)
When limits are set click Save to apply changes or Cancel to close the window.
Note
VE_DEFAULT package is not a real package, it's a view for default limits. You can modify default limits on a Users tab.
On cPanel limits of package named default are applied to users with default package assigned.
MySQL Governor package limits
Starting from the:
governor-mysql - 1.2-80
lvemanager - 7.8.3-1
lve-utils - 6.4.6-1
alt-python27-cllib - 3.2.40-1
The possibility to manage Mysql Governor package limits was added. This can be done via CloudLinux Manager or via command line.
How to install
yum update governor-mysql lvemanager lve-utils alt-python27-cllib
Meaning
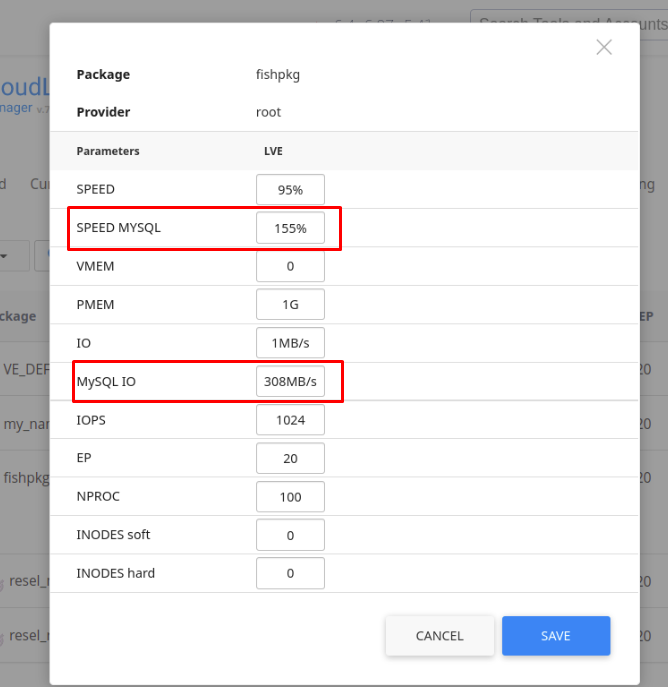
In all previous versions admin had possibility to manage individual MySQL Governor limits like:
- SPEED MYSQL
- MySQL IO
Now admin can manage all those limits for hosting packages and this will increase the convenience of administration.
All principles of working with MySQL Governor package limits are the same as for LVE limits:
- Initial limits for package can be settled from the the LVE extension (cPanel only) or they are inherited from the DEFAULT package (user).
- Non default (updated) package limits will not be changed in case DEFAULT limits are changed.
- Users in the package inherit package’s limits or have individual limits.
- Individual user limits can be reseted to the package’s limits.
- In case of reseller’s packages and users Mysql Governor limits can be managed only by admin.
Manage MySQL Governor limits
To view the package limits open this page:
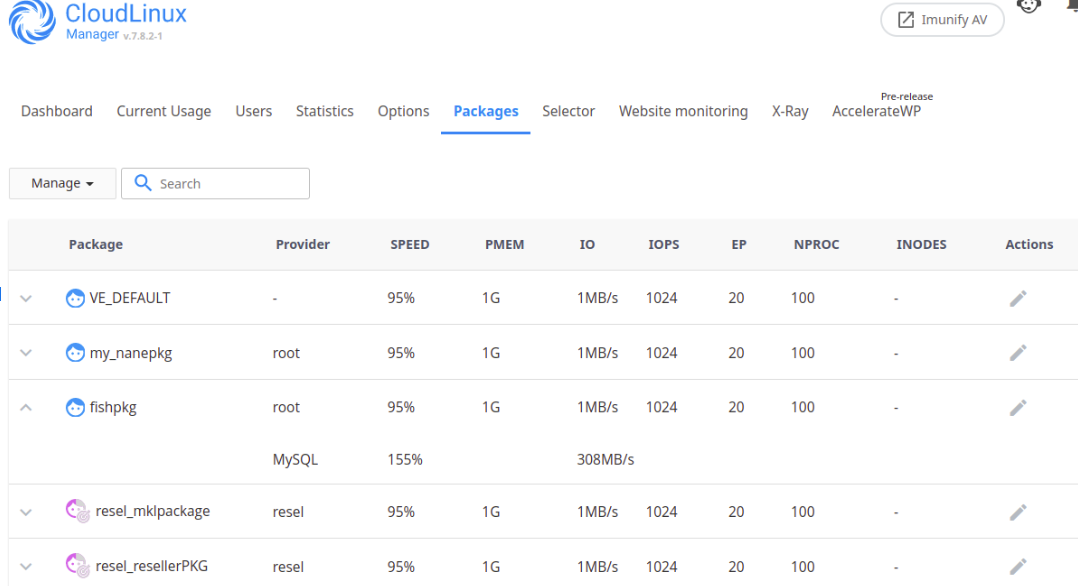
To manage the package limits edit the needed package:
PHP Selector
- Selector tab
- Selector tab additional features (cPanel) CloudLinux Manager 6.0.1-2
- PHP Selector troubleshooting (cPanel) CloudLinux Manager 6.0.1-2
- PHP Selector diagnostic tool and notifications CloudLinux Manager 6.0.1-2
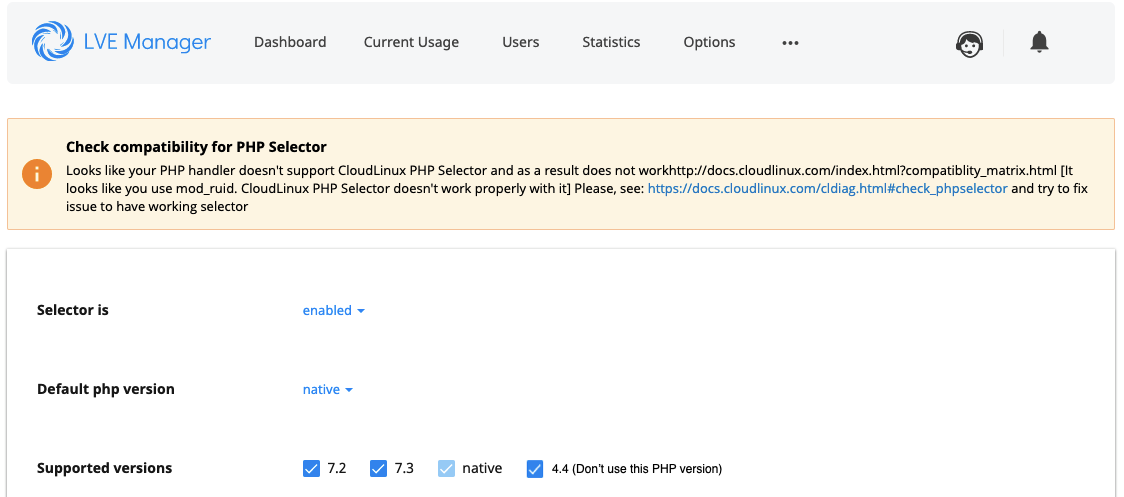
Selector tab
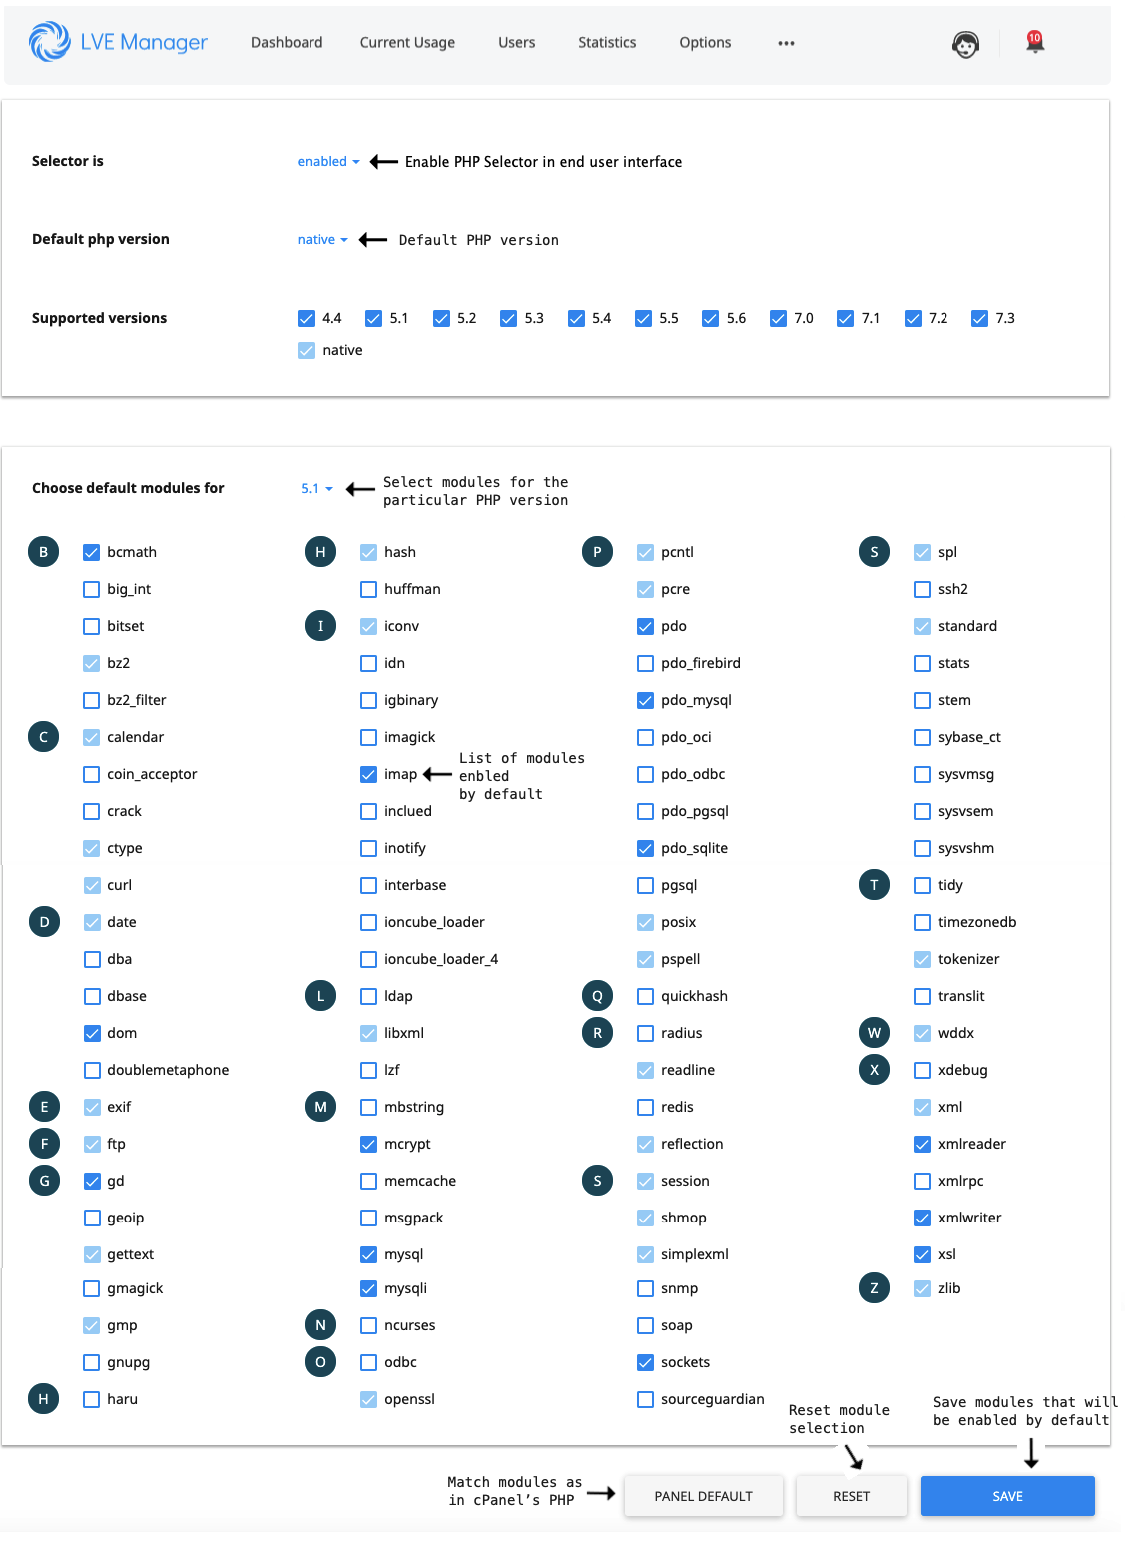
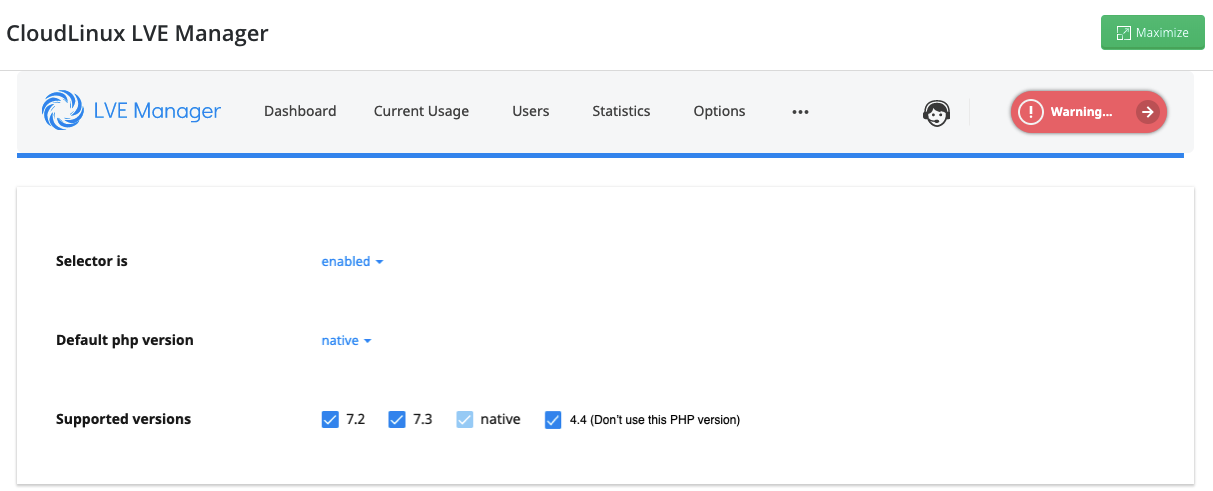
Selector tab allows controlling PHP Selector settings.
- In Selector is section choose
EnabledorDisabledfrom the dropdown list to enable or disable PHP Selector. - In Default PHP version choose a proper PHP version or Native from dropdown list to apply.
- In Hide php extensions for end-user you can enable/disable the ability for end-user to select PHP extensions in his web interface.
- In Supported versions choose required PHP versions to support.
Choose default modules from the list for a proper PHP version or for native.
Note
You can also use PHP Selector CLI
Selector tab additional features
Go to cPanel admin interface → CloudLinux manager → Selector
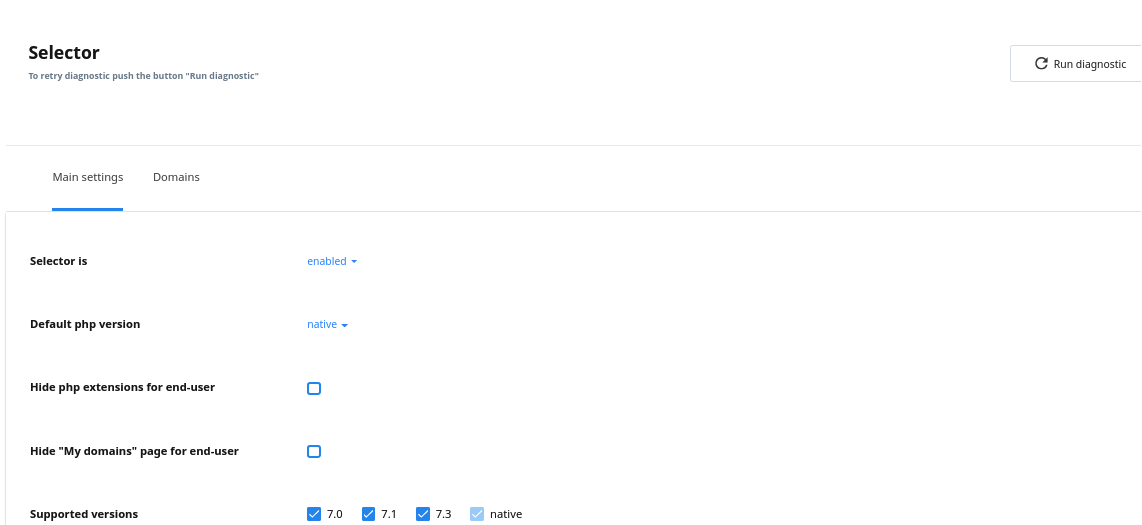
Selector tab has two sub tabs: Main settings and Domains.
- Main settings sub tab allows to config general settings for PHP Selector
- Selector is: allows to enable/disable PHP Selector
- Default PHP version: allows to set PHP version by default
- Hide PHP extensions for end-user: allows to hide PHP extensions
- Hide "My domains" page for end-user: allows to disable such tab for end-user
- Supported versions: allows to select supported PHP versions
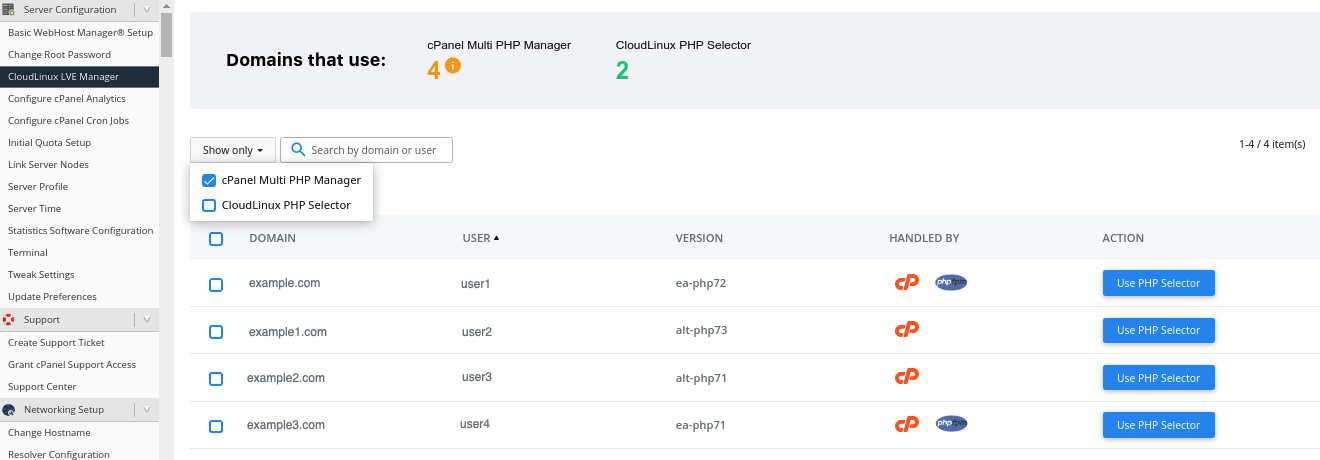
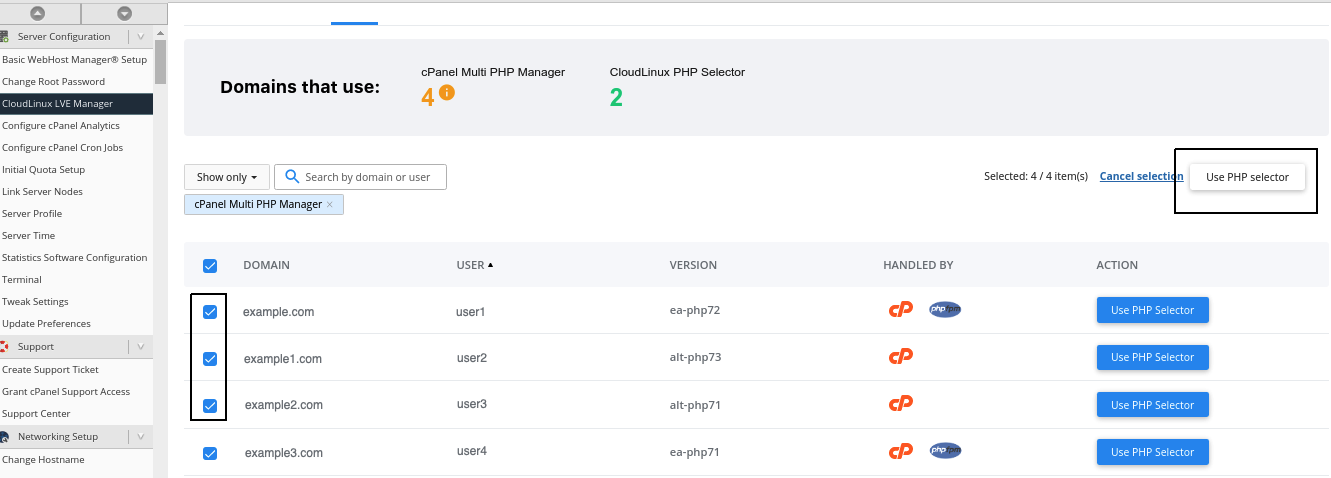
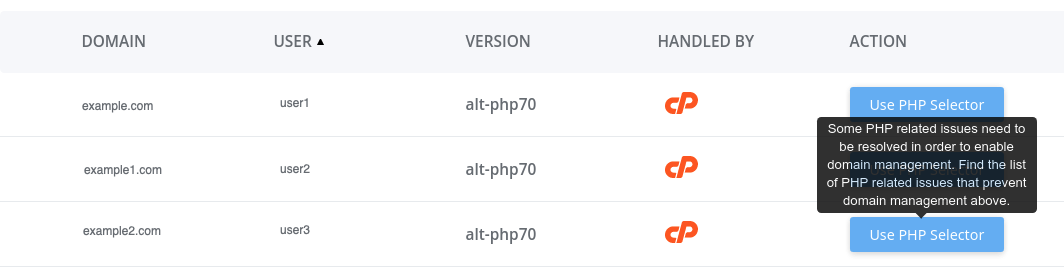
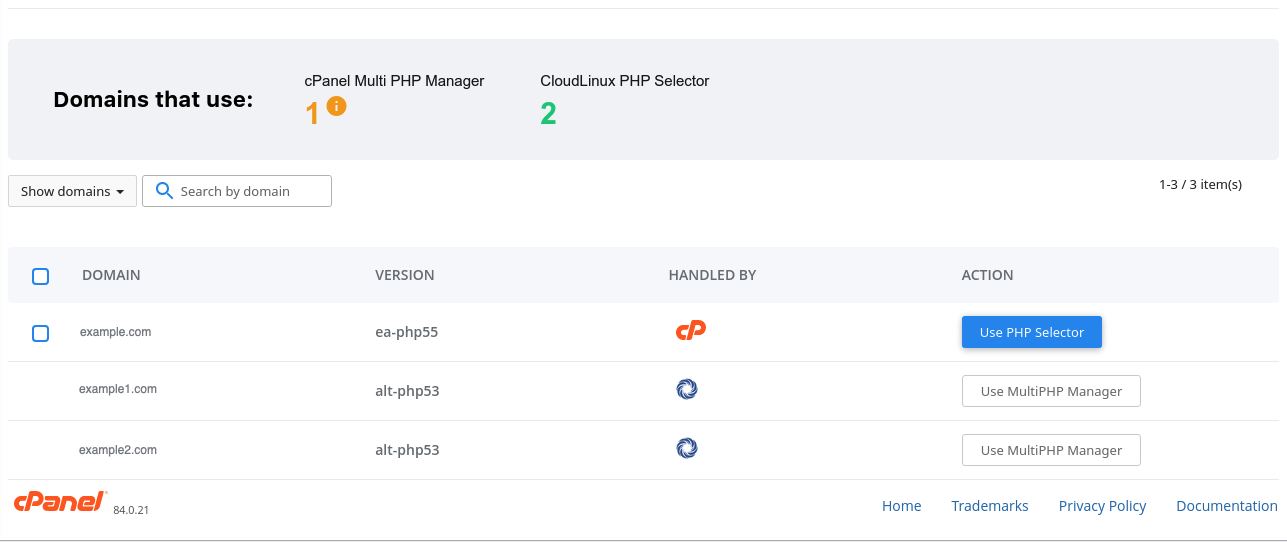
- Domains sub tab contains the list of User-Domain pairs to visualize which PHP Selector is used by a domain
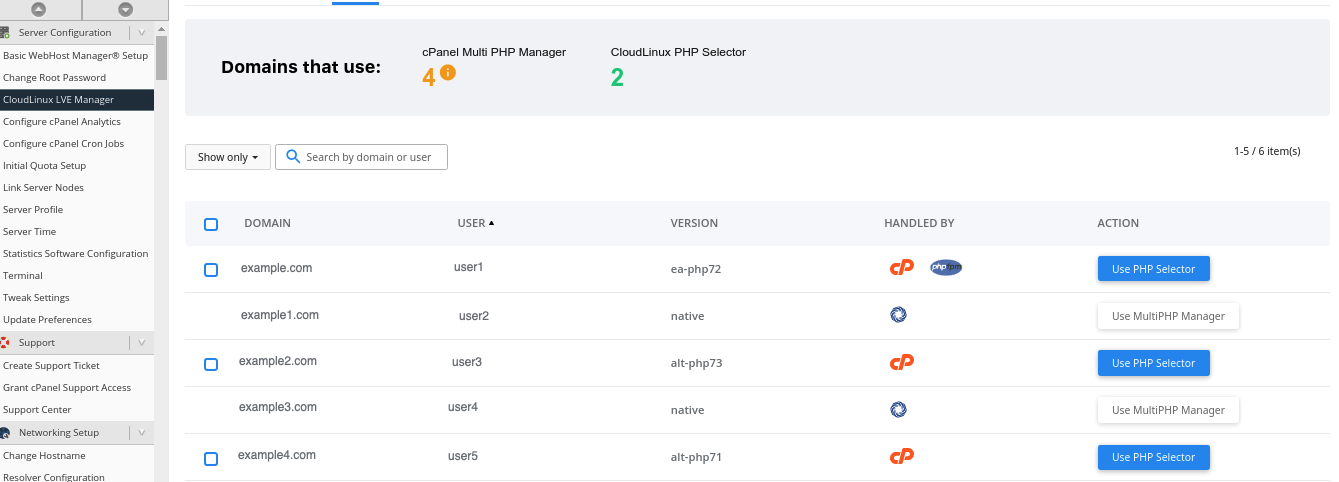
Admin can filter the list:
If an admin clicks Use PHP selector in the Action table, the PHP version for a domain in MultiPHP Selector is changed to the system default version and php-fpm is disabled. Users' websites will use the version set in CloudLinux OS Shared PHP Selector (user interface). Group operation also can be used.
PHP Selector troubleshooting
You can see the following errors in the Domains tab.
- PHP Selector cannot be activated for this domain. Initialize CageFS in the Options tab first.
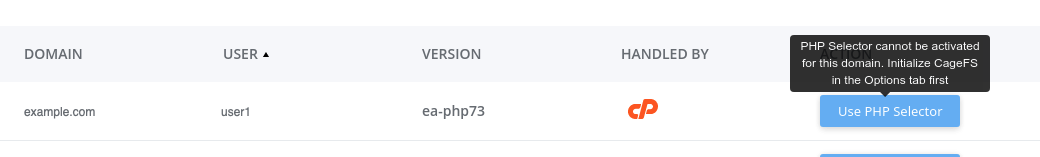
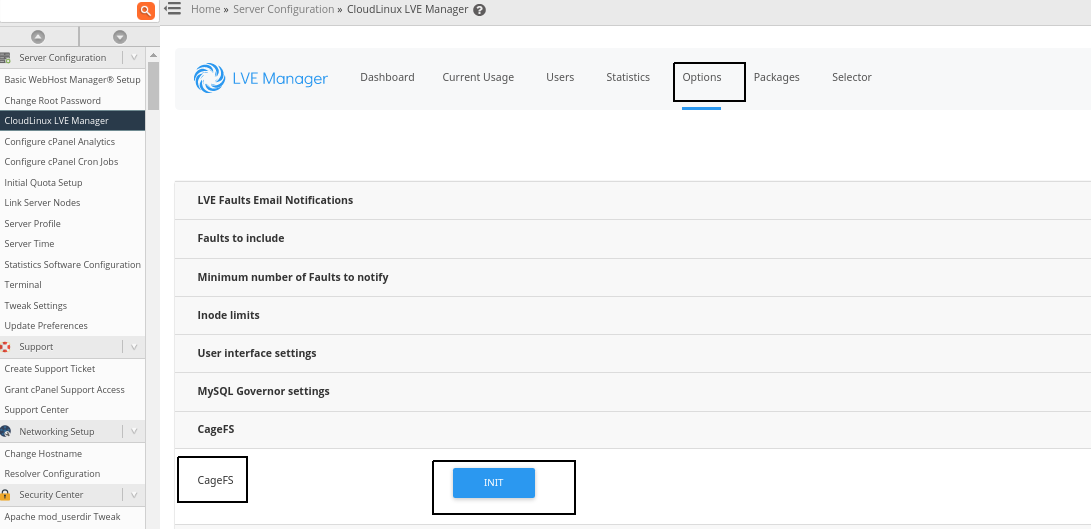
Solution
Initialize CageFS in the Options tab (see installation instructions).
- PHP Selector cannot be activated for this domain. Enable CageFS for this user in the Users tab first.
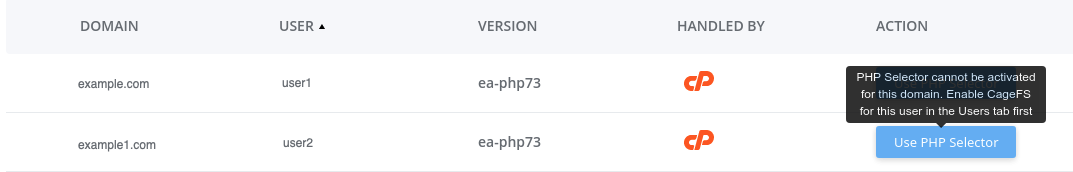
Solution
Enable CageFS in the Users tab (see installation instructions).
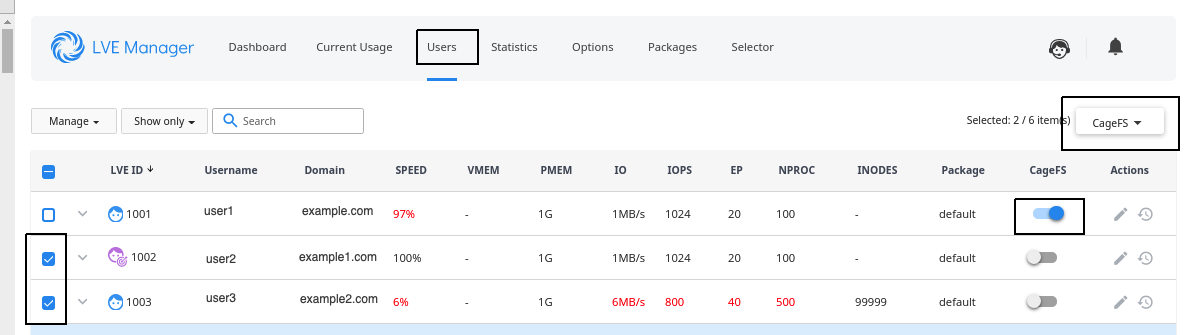
- You can enable CageFS for one user by individual slider (for lve 1001 in the picture above)
- You can enable CageFS for a group of user by the CageFS button (for lve 1002, 1003 in the picture above)
- Some PHP related issues need to be resolved in order to enable domain management. Find the list of PHP related issues that prevent domain management above.
Solution
If you cannot see Diagnostic tool notifications, you can restart it. Then you can fix the issues using these instructions.
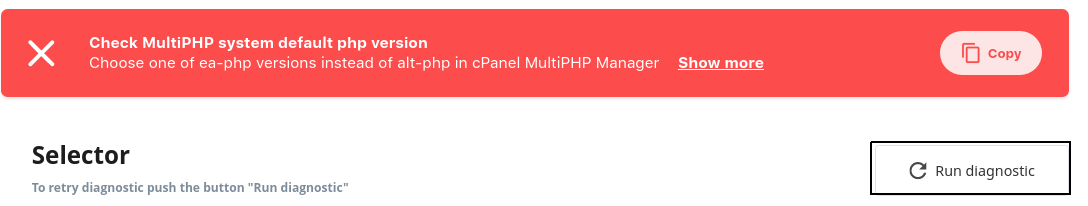
PHP Selector diagnostic tool and notifications
The diagnostic tool allows to catch some issues. You can start diagnostic by clicking Run diagnostic button.
The most popular errors and solutions:
- Your PHP Handler does not support CLoudLinux OS Shared PHP Selector
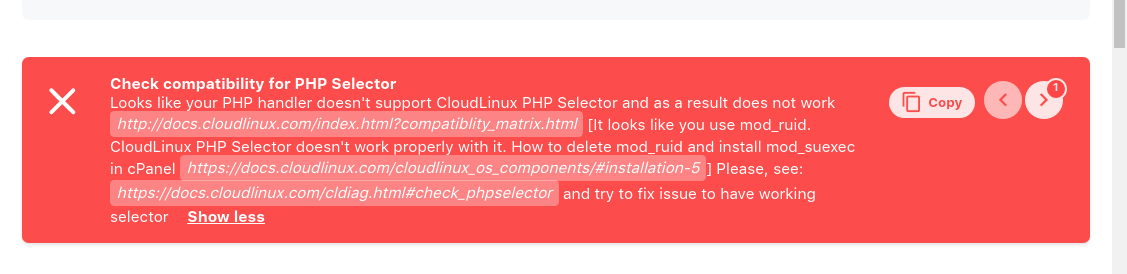
Solution: install mod_suexec (see instructions here) and then run the following command:
cagefsctl --force-update
- Incorrect config file format
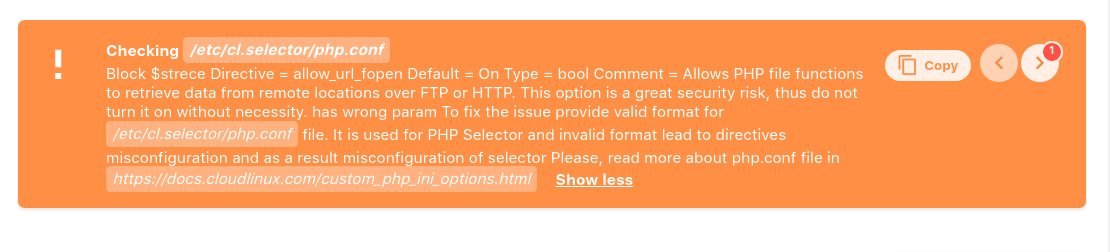
Solution: correct the file format via SSH.
- Some domains have neither PHP version selected in MultiPHP Manager no system default version or have
php-fpmenabled.
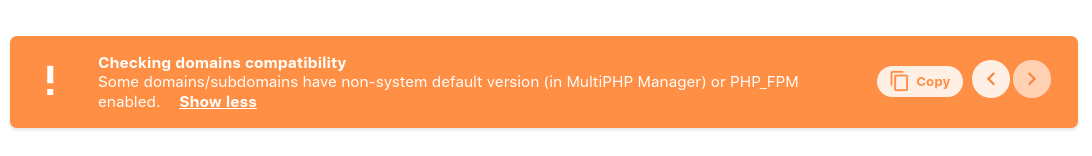
Solution: see installation instructions for cPanel users
- MultiPHP system default version is not ea-php
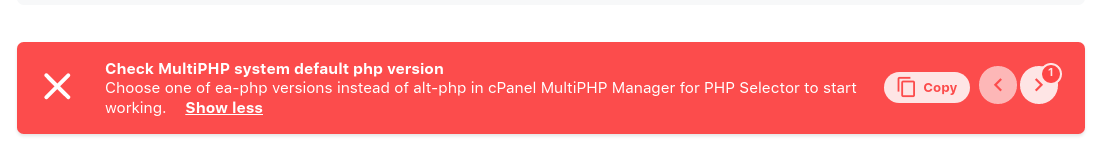
Solution: see installation instructions for cPanel users
In the CloudLinux Manager v.6.0.6-1 the diagnostic tool can not catch problems with CageFS. See installation instructions for cPanel users.
Python Selector
- How to enable/disable Python Selector
- How to manage Python Selector
- Enable and disable particular Python version
- Install and delete particular Python version
- Make a particular Python version as a default
- Applications column
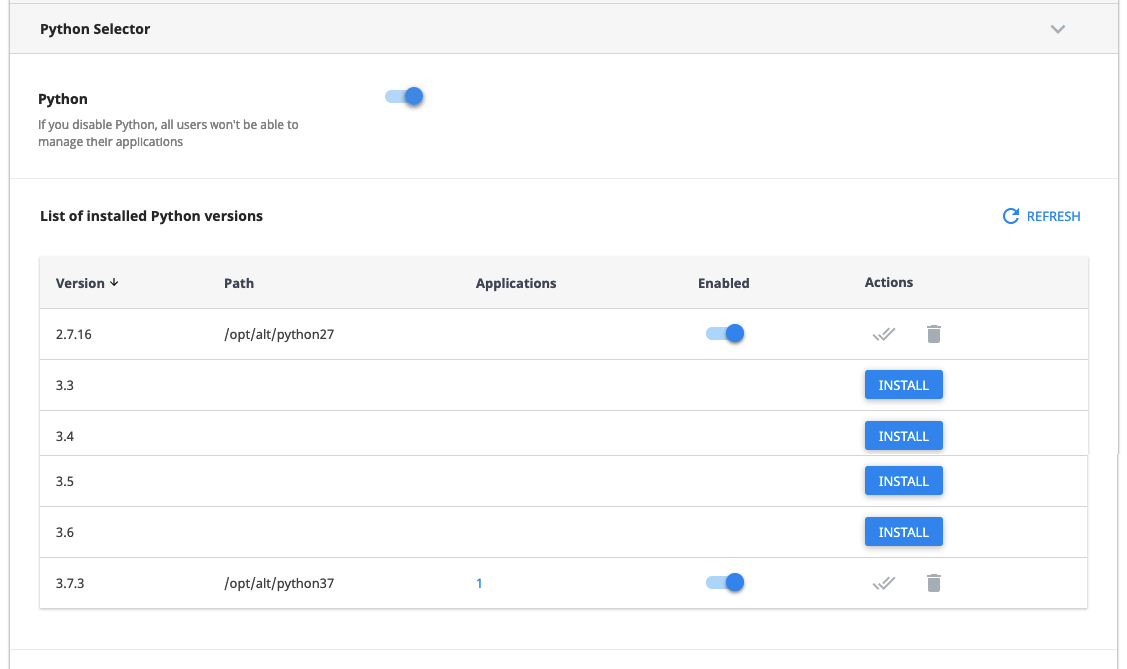
Hoster interface allows to enable and disable Python Selector and manage individual Python versions.
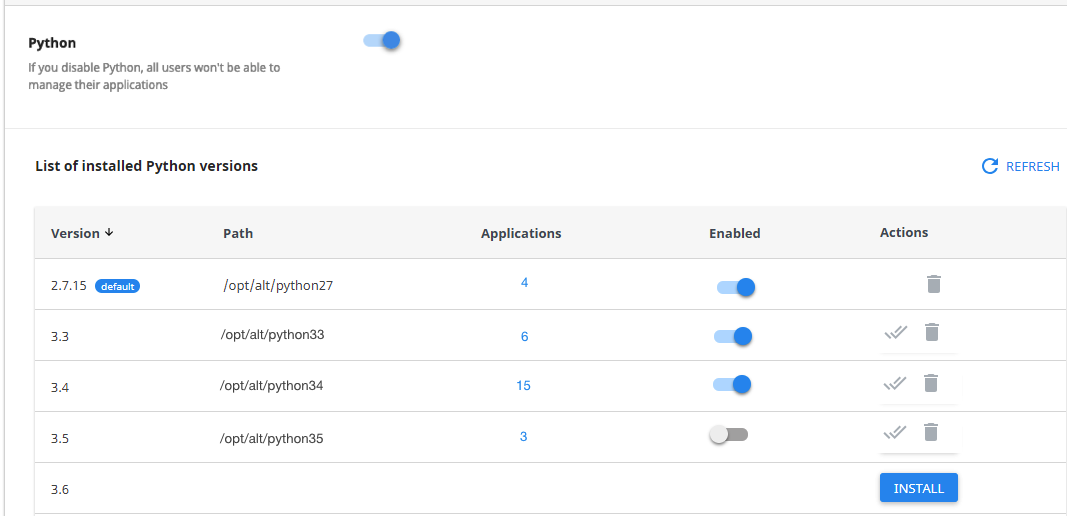
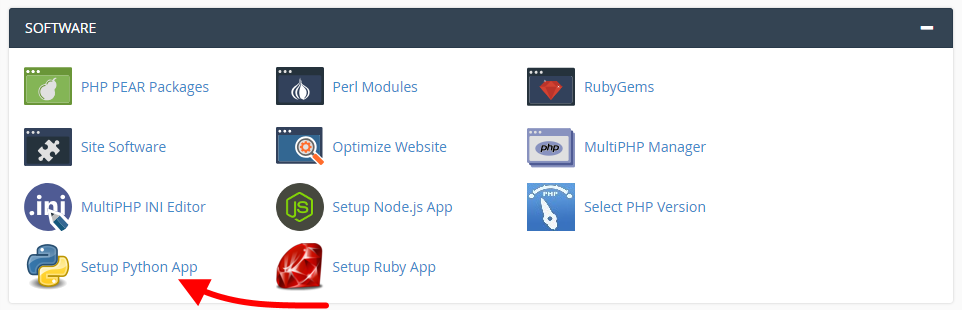
Go to CloudLinux Manager → Options Tab → Python Selector.
A list of installed Python versions is displayed. There are several columns in the list.
- Version — displays Python version.
- Path — Python package location.
- Applications — number of applications that use this Python version. Click on an application number to go to the list of applications.
- Enabled — displays if particular Python version is enabled.
- Actions — allows to install, delete, and make default a particular Python version.
To display all changes immediately click Refresh.
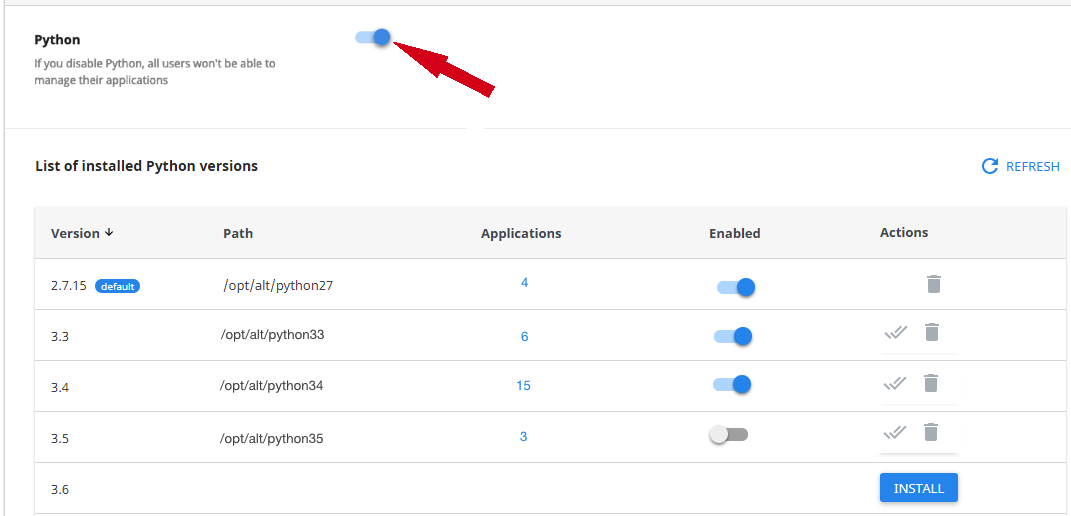
How to enable/disable Python Selector
To enable Python Selector move a slider to Enable and complete the action by clicking Agree or click Cancel to close the popup. To disable Python Selector move a slider back to Disable.
Note
If you disable Python, all users won't be able to manage their applications
Note
Python Selector icon in end user interface is hidden when Python is disabled.
How to manage Python Selector
In the list of installed Python versions you can enable and disable, install and delete, and set a particular Python version as a default.
Enable and disable particular Python version
To enable particular Python version do the following:
- Move a disabled slider in the Enabled column for a particular Python version.
- In the confirmation popup click Agree to save changes or Cancel to close popup.
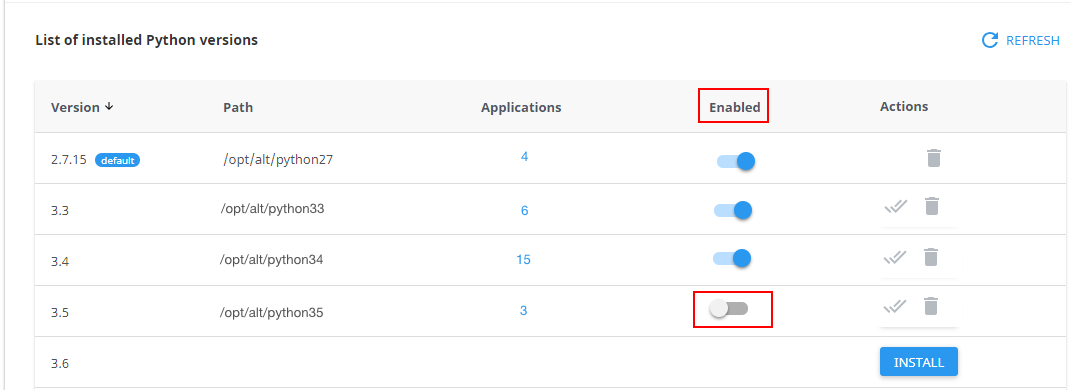
To disable particular Python version do the following:
- Move an enabled slider in the Enabled column for a particular Python version.
- In the confirmation popup click Agree to save changes or Cancel to close popup.
Install and delete particular Python version
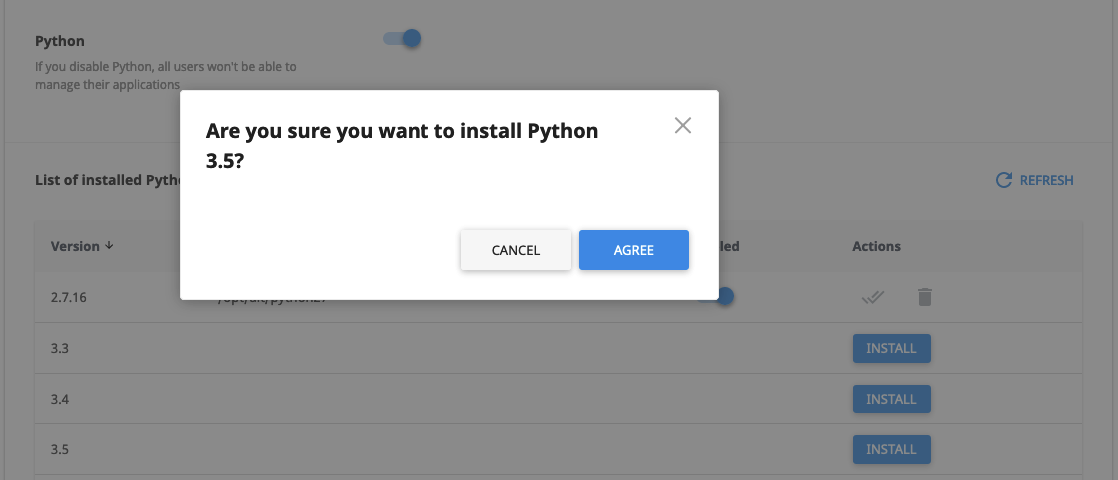
To install particular Python version do the following:
- Click Install button in the Actions column for a particular Python version.
- In the confirmation popup click Agree to save changes or Cancel to close popup.
To delete particular Python version do the following:
- Click Bin icon in the Actions column for a particular Python version.
- In the confirmation popup click Agree to start uninstalling process. Or close popup without changes by clicking Cancel button.
Note
It is impossible:
- to remove default Python version
- to remove version with applications
- to install or remove version if another installation/uninstalling process is running
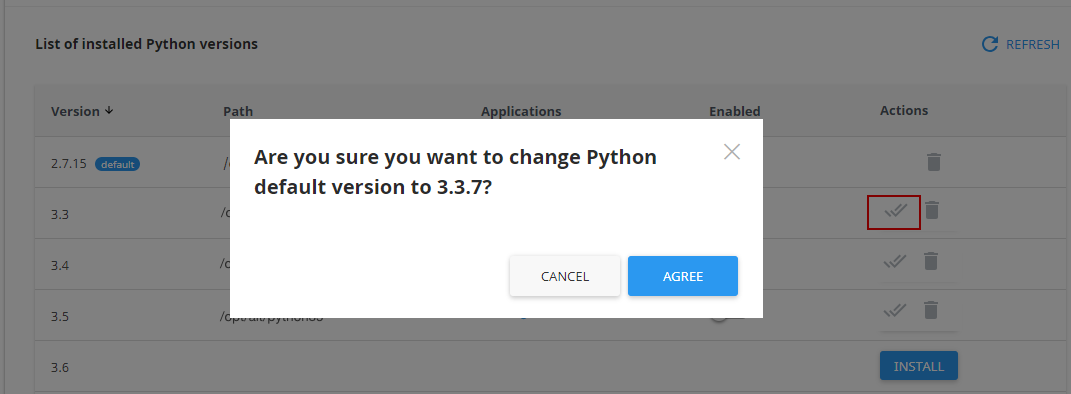
Make a particular Python version as a default
Note
You can set a particular Python version as a default version in the CloudLinux OS Shared installation wizard during the first installation.
To make a particular Python version as a default version, do the following:
- Click Double-Tick icon in the Actions column for a particular Python version.
- In the confirmation popup click Agree to save changes or Cancel to close popup.
Note
It is impossible to make disabled Python version as a default version
Applications column
To view and operate with the list of domains with Python versions click a number in the Applications column for a particular Python version. A section with a list of Domains for particular Python version will be displayed.
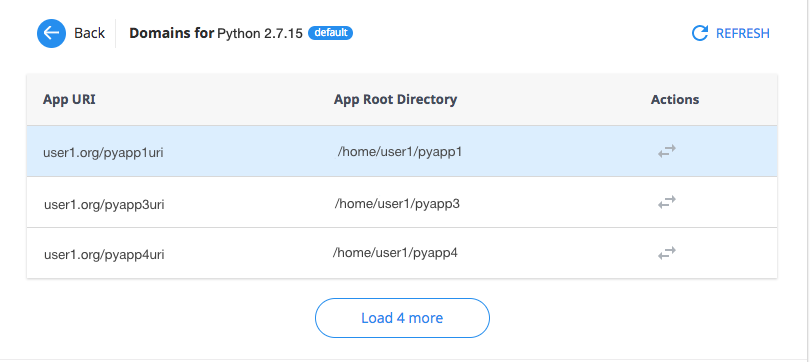
Domains are displayed by three. To load more domains click Load More button.
To change Python version for a particular application do the following:
- Click Double-Arrow icon in the Actions column in a particular application row. A confirmation popup will be displayed.
- In the popup choose Python version from a dropdown.
- Click Change to confirm the action or Cancel to close the popup.
- To refresh state of applications in current version you can click Refresh.
Note
All packages of the application(s) will be re-installed.
Note
You can also use Python Selector CLI
See also: Python Selector client plugin
Node.js Selector
- How to enable/disable Node.js
- How to manage Node.js
- Enable and disable particular Node.js version
- Install and delete particular Node.js version
- Make a particular Node.js version as a default
- Applications column
- Application error log
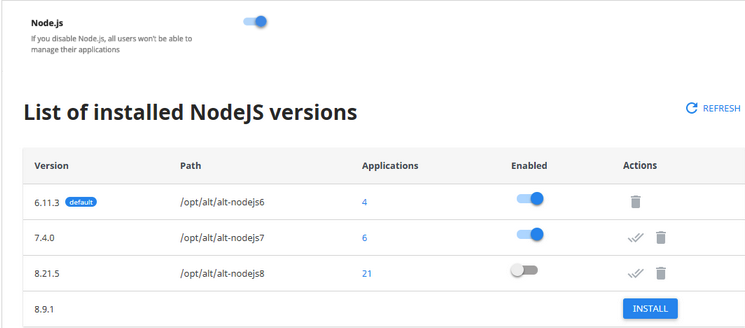
Hoster interface allows to enable and disable Node.js, and manage individual Node.js versions.
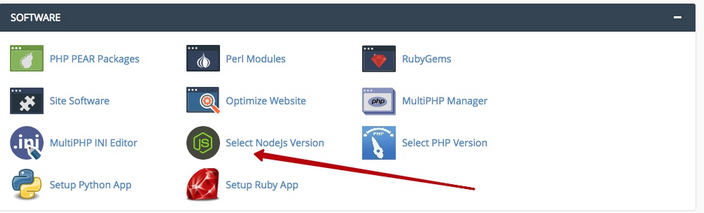
Go to CloudLinux Manager → Options Tab → Node.js Section. A list of installed Node.js versions is displayed. There are several columns in the list.
- Version — displays Node.js version.
- Path — Node.js package location.
- Applications — number of applications that use this Node.js version. Click on a digit to go to the list of applications.
- Enabled — displays if particular Node.js version is enabled.
- Actions — allows to install, delete, and make default a particular Node.js version.
To display all changes immediately click Refresh link.
How to enable/disable Node.js
- To enable Node.js move the slider to Enable.
- To disable Node.js move the slider back to Disable.
Note
If you disable Node.js, its version for all your applications will not be changed, but you can not add a new application to this version.
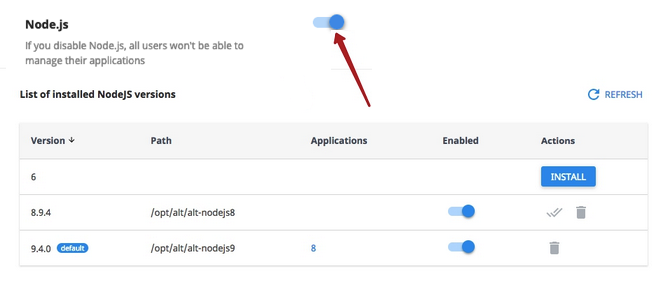
Note
Node.js Selector icon in end user interface is hidden when Node.js is disabled.
How to manage Node.js
The list of installed Node.js versions allows to enable and disable, install and delete, and set a particular Node.js version as a default.
Enable and disable particular Node.js version
To enable particular Node.js version do the following:
- Move a disabled slider in the Enabled column for a particular Node.js version.
- In the confirmation pop-up click Agree to save changes or Cancel to close pop-up.
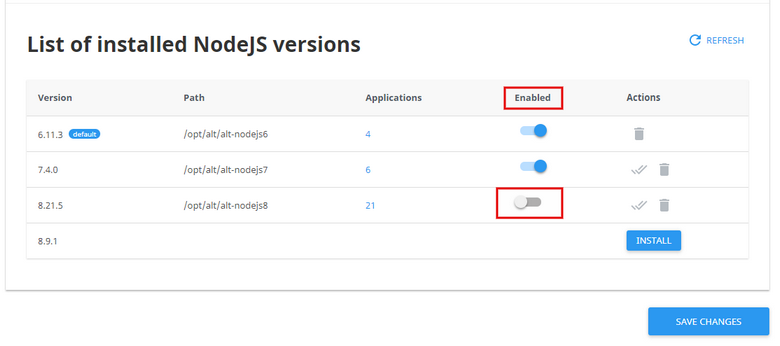
To disable particular Node.js version do the following:
- Move an enabled slider in the Enabled column for a particular Node.js version.
- In the confirmation pop-up click Agree to save changes or Cancel to close pop-up.
Install and delete particular Node.js version
To install particular Node.js version do the following:
- Click Install button in the Actions column for a particular Node.js version.
- In the confirmation pop-up click Agree to save changes or Cancel to close pop-up.
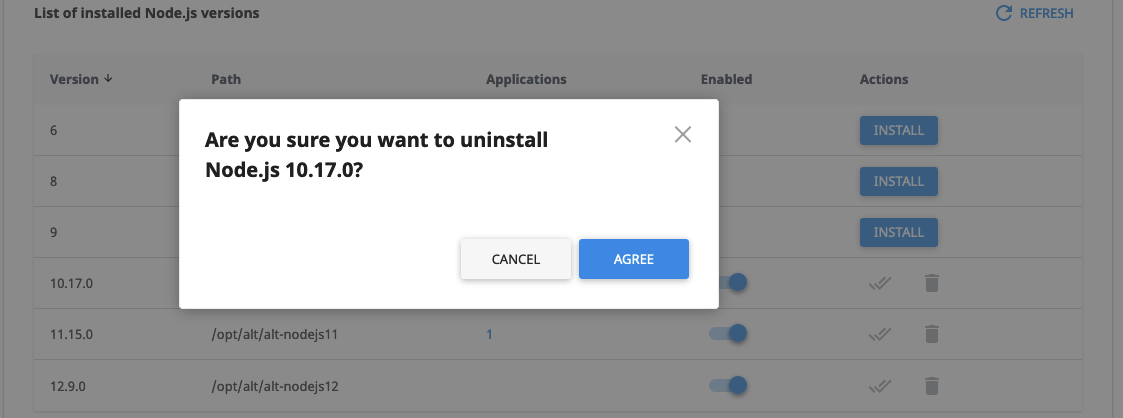
To delete particular Node.js version do the following:
- Click Bin icon in the Actions column for a particular Node.js version.
- In the confirmation pop-up click Agree to start uninstall process.
- Or just close a pop-up without any changes.
Note
It is impossible:
- to remove default Node.js version;
- to remove version with applications;
- to install or remove version if another installation/uninstall process is running.
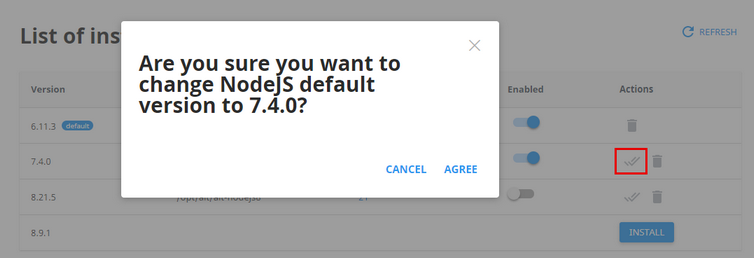
Make a particular Node.js version as a default
To make a particular Node.js version as a default do the following:
- Click Double-Tick icon in the Actions column for a particular Node.js version.
- In the confirmation pop-up click Agree to save changes or Cancel to close pop-up.
Note
It is impossible to make a disabled version default.
Applications column
To view and operate with the list of domains with Node.js versions click on a number in the Applications column for a particular Node.js version. A section with a list of Domains for particular Node.js version will be displayed.

Domains are displayed by three. To load more domains click on Load More button.
To change Node.js version for a particular application do the following:
- Click Double-Arrow icon in the Actions column in a particular application row. A confirmation pop-up will be displayed.
- In the pop-up choose Node.js version from a drop-down.
- Click Change to confirm the action or Cancel to close the pop-up.
- To refresh state of applications in current version you can click Refresh link.
Note
All packages of the application(s) will be re-installed.
Note
You can also use Node.js Selector CLI
See also: Node.js Selector client plugin
Application error log
Since alt-mod-passenger version 5.3.7-3 we have included support for the PassengerAppLogFile directive.
Syntax: PassengerAppLogFile path
Default: PassengerAppLogFile path-to-passenger-log-file
Context: virtual host, htaccess
By default, Passenger log messages are all written to the Passenger log file. With this option, you can have the app specific messages logged to a different file in addition. In alt-mod-passenger , you can use it in the context of a virtual host or in the htaccess file.
See also: Node.js Selector CLI tools.
Website monitoring tool and Slow Site analyzer
- Website monitoring tab
- Main
- PHP Slow Site analyzer
- Settings
- What is the density threshold?
- Email notifications
- The cloudlinux-ssa-manager CLI utility
- The wmt-api CLI utility
- FAQ
Website monitoring tool is a new tool that collects the statistics of the domains' availability and responsiveness, as well as errors that occur when accessing these domains. An admin can get email reports with the statistics. The website monitoring tool uses the simple curl request like curl http://domain.com to get domains’ statistics.
PHP Slow Site analyzer is a new tool that generates daily reports for the server administrator with information about the top N slow PHP-based domains and URLs. Slow Site analyzer tracks all PHP-based requests and selects slow ones by certain rules.
Note
Slow Site analyzer is not available for CloudLinux OS Shared 6.
Installation
To install the tool, run the following command:
yum update lvemanager
Warning
For now, there is no any possibility to remove the alt-php-ssa and cl-web-monitoring-tool packages so that the Website monitoring tab will be removed. This possibility will be added in the future releases.
You can turn off the Website monitoring, PHP Sites Analyzer in the Settings subtab, so sites statistics will stop collecting and there will be no additional load on the server.
Website monitoring tab
You can configure the Website monitoring tool and Slow Site analyzer and view the daily reports in the CloudLinux Manager -> Website monitoring tab.
There are Main, PHP Site analyzer, and Settings subtabs here.
Main
This subtab views the latest report (for the previous day) of the Website monitoring tool.
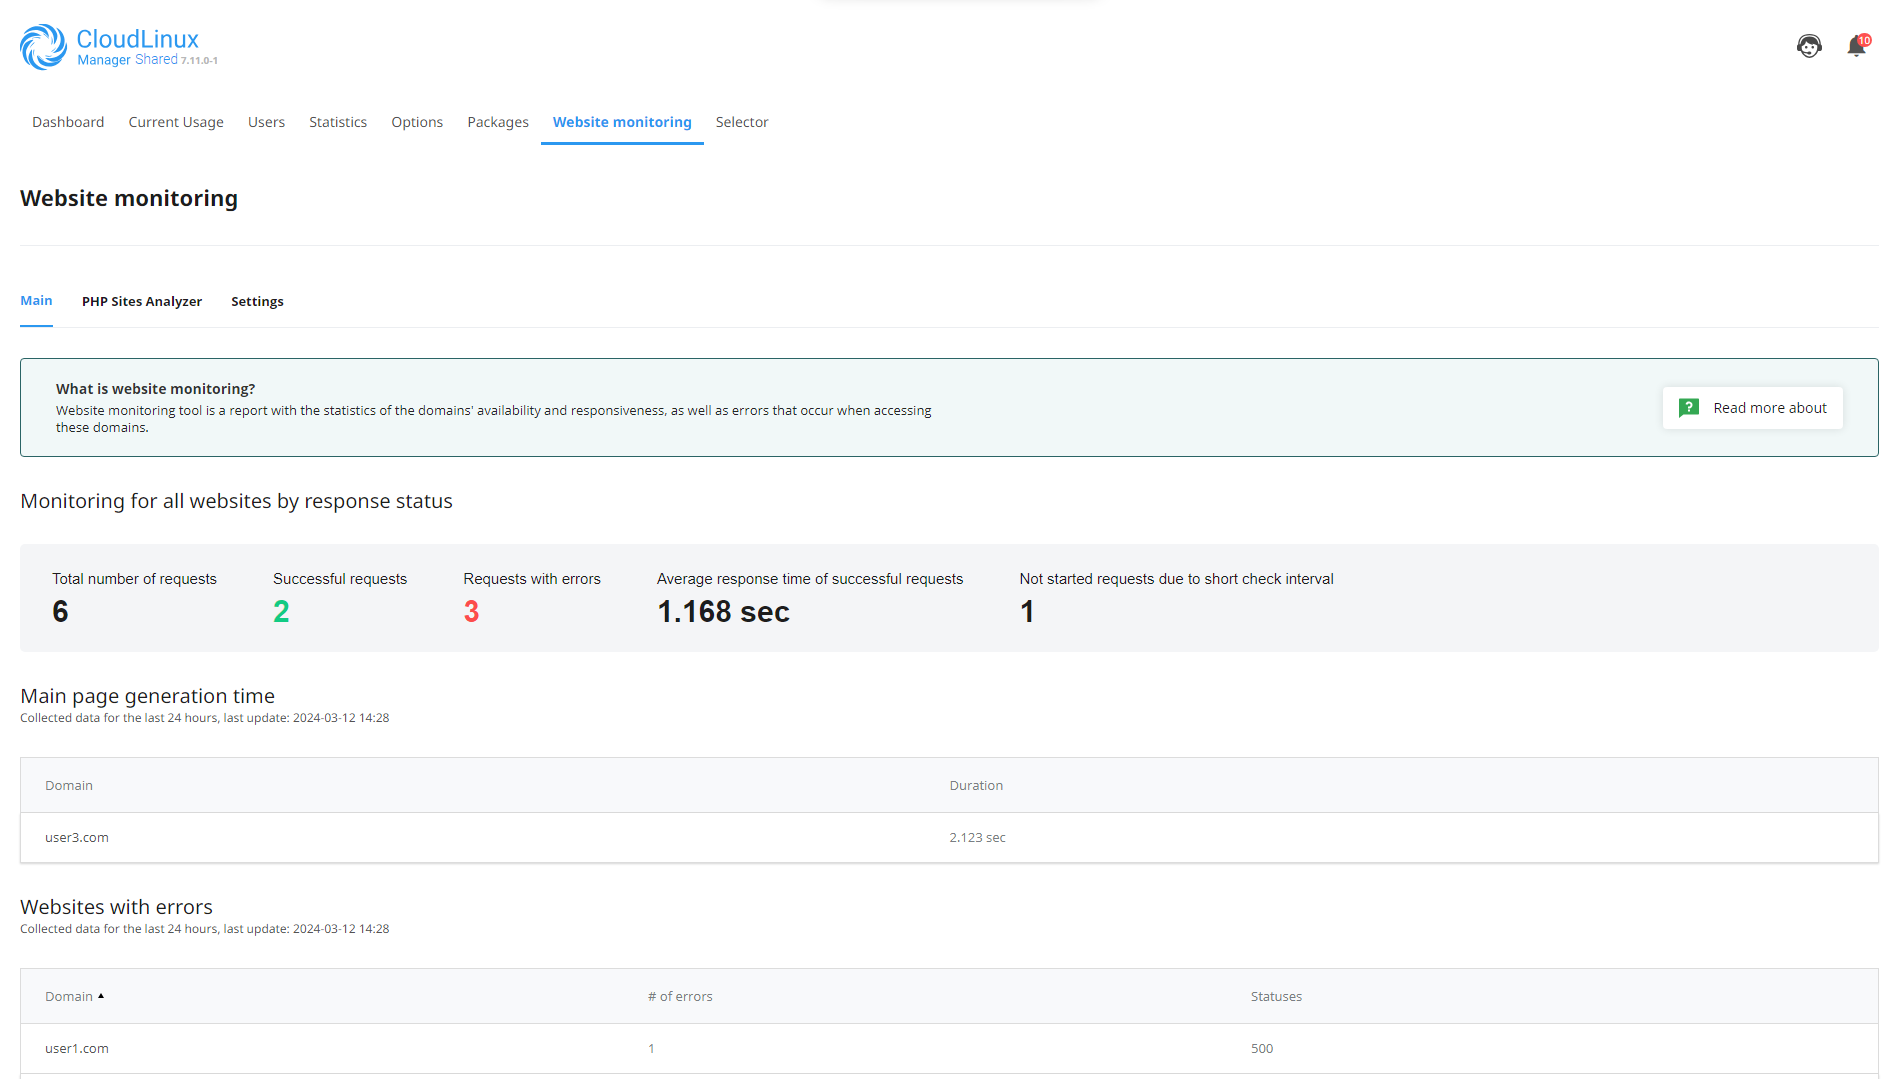
Remember that report is created every 24 hours and all changes in configuration (the Settings tab) or in the list of domains will be applied for the next 24 hours (from midnight).
Total number of requests - requests that were sent to all domains, existing on the servers
Successful requests - the number of requests for all domains with

Requests with errors - the number of requests for all domains which status code is not 200
Not started requests due to short check interval - this metric is used to adjust configuration. If it is not equal 0, an admin should increase the value of Requests sending interval, because the tool does not fit into this interval to send requests to all domains.
Slowest websites in 24h and Websites with most errors in 24h - in these sections you can find the number of domains that was exposed here.
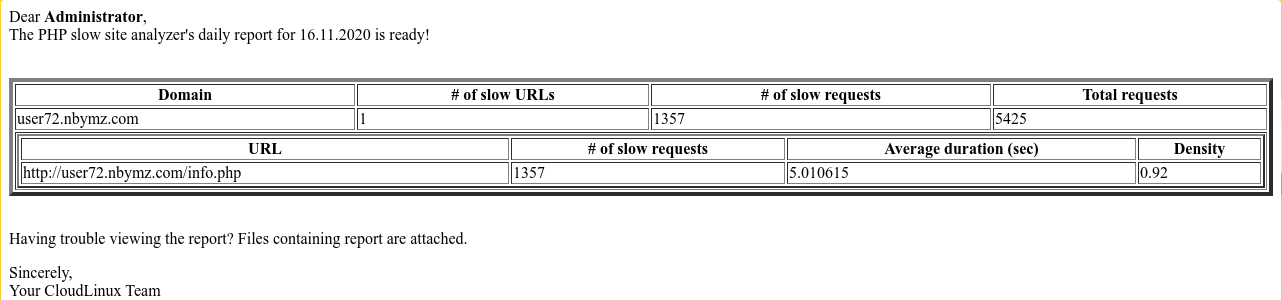
PHP Slow Site analyzer
Note
The Slow Site analyzer is not available for CloudLinux OS Shared 6.
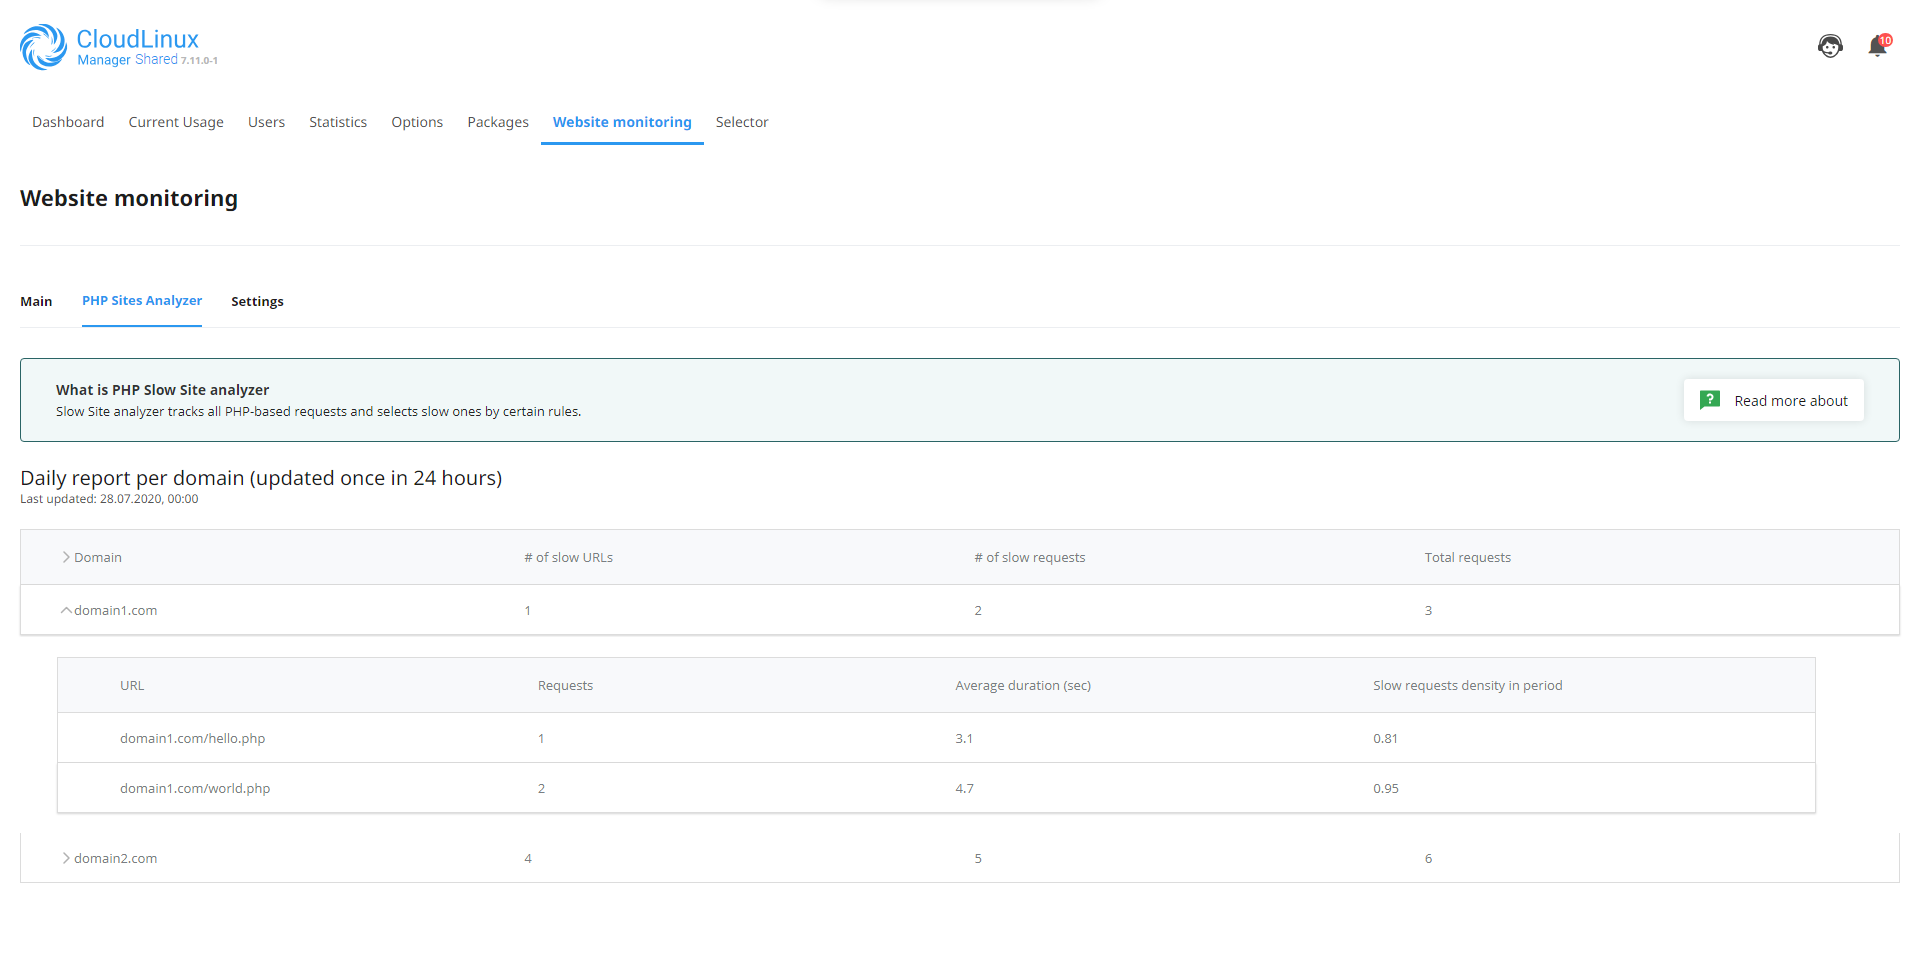
This is an example of a report from the Slow Site analyzer. The report shows the number of slow requests per domain and its URLs and the average duration of each slow URL.
You can find the explanation of the Slow requests density in period here.
Settings
Here, an admin can configure the Website monitoring and the PHP Site analyzer.
Note
All settings which was changed after starting Website monitoring and Slow site analyzer will be applied for the next 24h (from midnight).
To enable or disable Website monitoring, use the following slider.

- Enable summary notifications - turn on/off summary daily email report notifications
- Enable alert notifications - turn on/off immediate alert email notifications
- Domains and URLs Ignore List - domains and URLs that will not be requested and displayed in reports; supported formats:
example.com, http://example.com - Top N slow websites to show - this number (N) will be used to select the top N domains from the list of all domains, sorted by response duration (Slowest websites list). And this number also will be used to select the top N domains from the list of all domains, sorted by amount of errors (Websites with most errors list).
- Check every X minutes - this is a period in minutes between requests to the same domain.
- Time allowed for response - if there is no answer from the website for this period of time, the Website Monitoring tool will regard this behaviour as the
HTTP 408error. - Concurrent requests limit - how many concurrent requests can be done by the Website Monitoring tool.
To enable or disable the Slow site analyzer, use the following slider.
Note
Slow Site analyzer is not available for CloudLinux OS Shared 6.

- Enable Autotracing - turn on/off Autotracing;
- Enable summary notifications - turn on/off summary daily email report notifications;
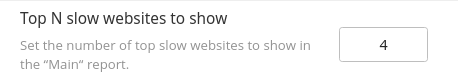
- Top N slow websites to show - Set the number of top slow websites to show in the “PHP Sites Analyzer“ report;
- Top slow URLs - this number (N) will be used to select the top N URLs for each domain, marked as slow;
- Slow request duration - the duration of a request in seconds. If the request duration was less than specified in this setting then this request will not be marked as slow;
- Slow requests number - number of slow requests in the period of time to mark the URL as a slow one;
- Analysis time - the period of time in hours required to analyze slow requests;
- Enable slow requests density threshold - turn on/off slow requests density threshold;
- Slow requests density threshold - can be in the interval [0..1], by default it is 0.8. The density threshold can be disabled. And the Domains and URLs Ignore List can be specified;
- Domains and URLs Ignore List - domains and URLs that will not be displayed in reports;
What is the density threshold?
We try to find the most interesting requests for the optimisation from all number of requests to domains during 24 hours. The Density threshold parameter helps to find the most visited URLs and the most popular requests.
A density threshold is a numerical measure of some type of correlation, meaning the power of the statistical relationship between slow requests and all requests to the domain. If this parameter is enabled then the resulting table will contain slow requests that have exceeded the specified threshold. Requests with the highest density are usually the most distributed per day and are considered valuable to users, thus interesting for optimization.
Slow requests that represent bursts of activity and are weakly related to all activity per domain typically have a low density and will be weeded out.
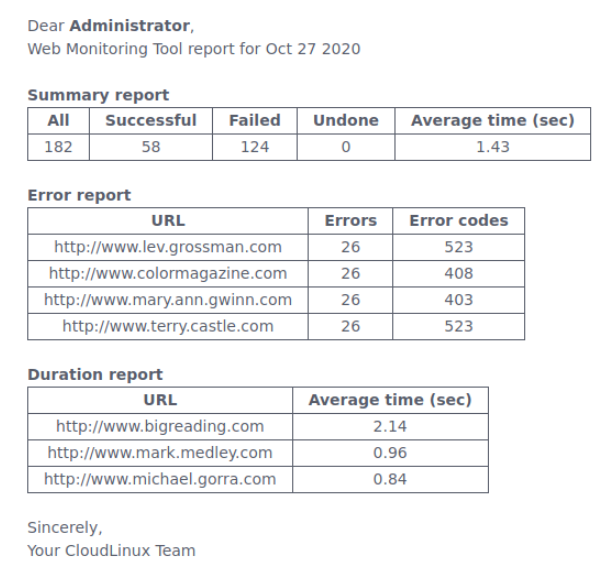
Email notifications
Email notifications are created by the Web monitoring tools.
Example of the Web monitoring tools report.
Example of the PHP Slow site analyzer report.
FAQ
Q: Does this feature consume a lot server resources for collecting website and PHP data? If I enable it can this slow down the server?
A: The load depends on the number of websites and the Website monitoring tool settings. Basically, the Website monitoring should not create a significant load and you can keep it always on.
Q: Can I change the default value to 10, for example for the "Top N slow websites to show" setting?
A: This number is simply the number of the slowest responding sites. All sites are sampled during the day. When generating a report, all sites' responses are sorted by response time from highest to lowest, and to make the report readable, only the first N sites are taken. You can specify N as all existing sites or only the 5 slowest. This number does not affect the server load, it only affects the report that will be visible in the UI or emailed to the administrator.
Q: What would you recommend: to enable the Website monitoring tool for some days and then disable or I can keep it always turned on?
A: The load depends on the number of websites and the Website monitoring tool settings. Basically, the Website monitoring tool should not create a significant load and you can keep it always on.
Reseller interface
Reseller interface is designed to manage limits for resellers’ end users, to monitor statistics and the history of resource usage and to modify reseller’s end user packages limits.
Log in under a particular reseller credentials to have access to the following functionality:
- Current Usage tab - allows to monitor resellers’ end users resource usage at the moment;
- Historical Usage tab - allows to control resellers’ end users resource usage history;
- Users tab with the list of all resellers’ end users allows to view and manage all the reseller’s end user limits;
- Statistics tab displays the statistics of resource usage for particular timeframe or particular reseller's end user;
- Options tab allows to set LVE Faults email notifications.
- Packages tab allows to manage reseller’s end user packages limits.
Reseller can manage all his end users via Reseller Interface. Reseller cannot manage INODE or MYSQL limits, neither his own nor for his users.
Current Usage tab
Current usage table provides the information on the usage of the following:
- SPEED (All)
- memory (MEM)
- data throughput (IO)(All)
- read/write operations per second (IOPS)
- number of processes (PNO)
- entry processes (EP)
Resource usage data is being refreshed every 10 seconds which is set by default in Auto-refresh field. You can set Auto-refresh time by choosing the value from the drop-down.
You can refresh the table manually by clicking Refresh now or you can freeze the values by clicking pause button.
Usage values will not change until the next manual refresh. To unfreeze click on unpause button. The countdown will continue.
Reseller cannot manage INODE or MYSQL limits. Neither his own, nor for his users.
The bottom line star in the table displays the total reseller resource usage. It means, that all the usage of resellers’ end users and of his own is displayed as a summary for each parameter.
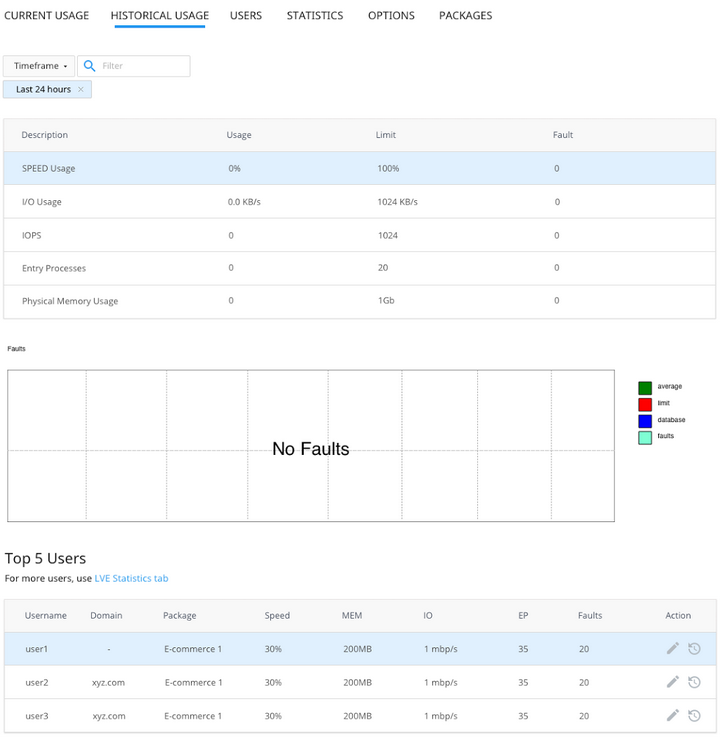
Historical Usage tab
Choose Historical Usage tab to view reseller and resellers’ end users resource usage history and faults. The list of users can be filtered by Timeframe.
When reseller’s end user reaches the limits set by hoster for the reseller, this will be displayed on the chart.
Note
In this case reseller’s end user would not necessarily reaches his limits set by the reseller. These faults are not displayed on the chart.
On the Historical Usage page the reseller is also able to see the list of Top 5 Reseller’s end users (based on resource usage, for the same period as charts/overall usage). Click History in the Actions column to view resource usage statistics for particular user.
Click LVE Statistics on the top of the Top 5 list to go to the Statistics page to view or manage the rest of users.
Users tab
Choose Users tab to view and manage the list of all resellers’ end users and resource usage limits provided for them. The following limits are available for the resellers’ end users:
- SPEED
- PMEM
- IO
- IOPS
- EP
- NPROC
You can filter the list by Username, Domain, LVE ID.
Tick Show only ignored users to display only users with MySQL Governor disabled.
Actions column
Click on a pencil icon in Actions column to edit limits for a particular user. The following actions are available:
- Click Reset to reset limits to default values.
- Click Apply for Do not limit to set unlimited resources to a user.
- Set values for PEED, PMEM, IO, IOPS, EP, and NPROC and click Save to save changes or Cancel to close the window.
Statistics tab
Choose Statistics tab to view resource usage limits statistics.
Statistics table can be filtered by Timeframe, Limit, Top LVEs, LVE approaching limit, Fault LVE.
The following parameters are displayed:
- SPEED per user;
- PMEM usage per user;
- IO usage per user;
- EP usage per user;
- NPROC usage per user;
- IOPS usage per user.
Use Charts in the View column to view detailed resource usage charts for a particular period of time.
For example, 7 days period chart.
Options tab
Choose Options tab to set user email notifications for resellers’ end users.
In LVE Faults email notifications section tick appropriate checkboxes to set the required type of notification.
Starting from CloudLinux Manager v.7.3.0-1 and LVE-Stats v.4.1.4-1 users can disable in their Resource Usage plugin email notifications about hitting LVE limits by themselves.
To allow users to do so, the reseller should enable the Notify Customers and Notify Reseller’s Customers options.
Unfortunately, it is not possible to disable LVE Faults Email Notifications for all users by default so that users can enable the feature themselves in their interface.
But it is possible to enable LVE Faults Email Notifications for all users by default, so that users can disable the feature themselves in their interface.
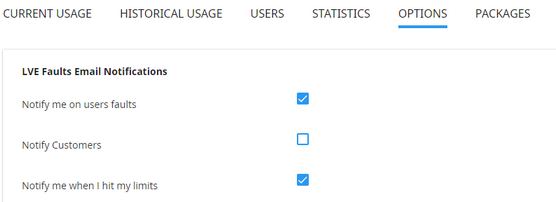
- Notify me on users faults - notify reseller when his users have exceeded limits.
- Notify Customers - notify resellers’ end users when they have exceeded limits.
- Notify me when I hit my limits - notify reseller when overall resource usage limits are reached.
In Faults to include section tick checkboxes to include particular limits to email notifications.
In Minimum number of Faults to notify section enter the number of faults required for the notification to be sent for reseller and customer. You can also set the reseller notification frequency.
Set the frequency of sending the reseller email notifications in Notify Reseller Every ... days/hours/minutes/seconds section.
Click Save Changes to apply changes.
Packages tab
Choose Packages tab to view and modify limits for reseller’s packages.
Click pencil icon in a package row to set the following limits for a package:
- SPEED limit;
- Physical memory (PMEM) (can be set as unlimited by setting 0);
- I/O limits;
- IOPS limits;
- Concurrent connections (EP) limits.
When limits are set click Save to apply changes.
LVE plugins branding
Note
Requires CloudLinux Manager 2.0-33+
It is possible to apply branding to the LVE Plugins in cPanel end users’ interface. To brand the cPanel end users' interface please do the following:
Create a script that will patch CloudLinux Manager files (with branding data, for example, image and logo) after every update of
lvemanager rpmpackage;Locate this script in
/usr/share/l.v.e-manager/branding_script;Make this script executable by running the command:
chmod a+x /usr/share/l.v.e-manager/branding_script
When done, the branding script will be executed while every update of lvemanager package and all branding changes will be applied in the end user’s interface.
Note
Modifying the CloudLinux Manager WHM plugin (/usr/local/cpanel/whostmgr/docroot/cgi/CloudLinux.cgi) via branding_script is not allowed.
User message for PHP version
Since version 1.0-4 CloudLinux Manager acquired a feature of adding user messages to PHP versions*. To add a message, you should create a file in /opt/alt/phpXX/name_modifier with a message that you want to be shown to a user.
For example, if you need to add the following message Don't use this PHP version to PHP version 4.4, you should create the following file:
/opt/alt/php44/name_modifier:

echo 'Don`t use this php version' > /opt/alt/php44/name_modifier
As a result, CloudLinux Manager will automatically pick up this message and will show it in web-interface to administrator (see Figure 1.1 for cPanel, Figure 1.2 for DirectAdmin) and to user (see Figure 2.1 for cPanel, Figure 2.2 for DirectAdmin). You can add messages to other PHP versions this way as well.
 |
| Figure 1.1 cPanel CloudLinux Manager (administrator) |
 |
| Figure 1.2 DirectAdmin CloudLinux Manager (administrator) |
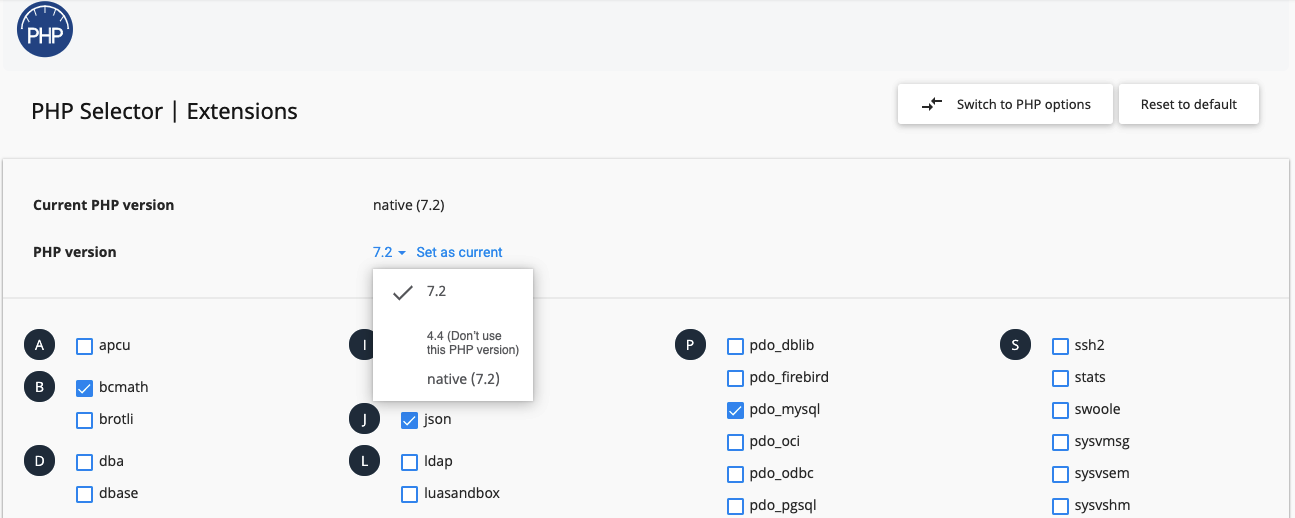 |
| Figure 2.1 cPanel CloudLinux Manager (user) |
 |
| Figure 2.2 DirectAdmin CloudLinux Manager (user) |
Note
*For cPanel and DirectAdmin only.
Client plugins
- Resource Usage client plugin
- Dashboard
- Current Usage
- Snapshot
- Python Selector client plugin
- Node.js Selector client plugin
- Ruby Selector client plugin
- PHP Selector client plugin
- PHP Selector. My Domains tab (cPanel) CloudLinux Manager 6.0.1-2
- CloudLinux Manager options
Resource Usage client plugin
Client resource usage plugin for cPanel, Plesk, and DirectAdmin allows host’s end users to view and monitor resource usage.
Go to your control panel and click CPU and concurrent connection usage.
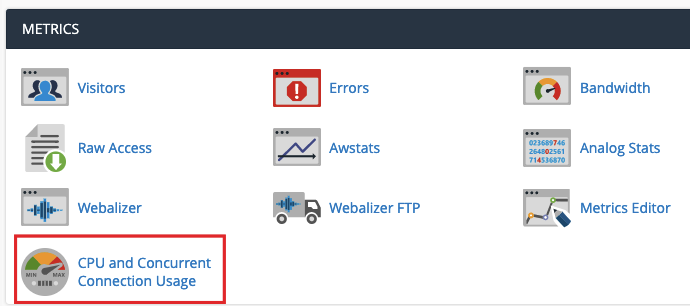
Here you can see three tabs:
- Dashboard: displays the general condition of your site. If your site is limited, this displays on the Dashboard.
- Current usage: here you can find full information on the resource usage displayed in charts and tables.
- Snapshot: server snapshots with processes list and database and HTTP queries.
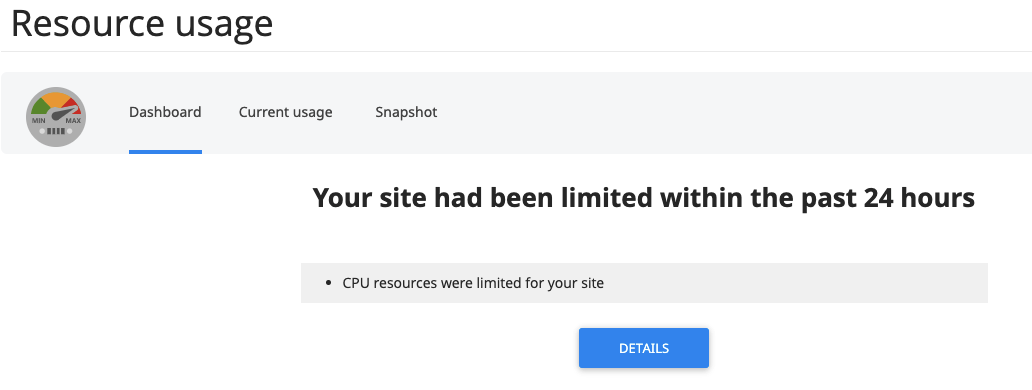
Dashboard
Go to the Dashboard tab to see the general condition of your site. If your site is limited, you can see this on the Dashboard with the resource you are limited over. To see detailed information about resource usage, click Details.
If your site is not limited, you will see the plain Dashboard.
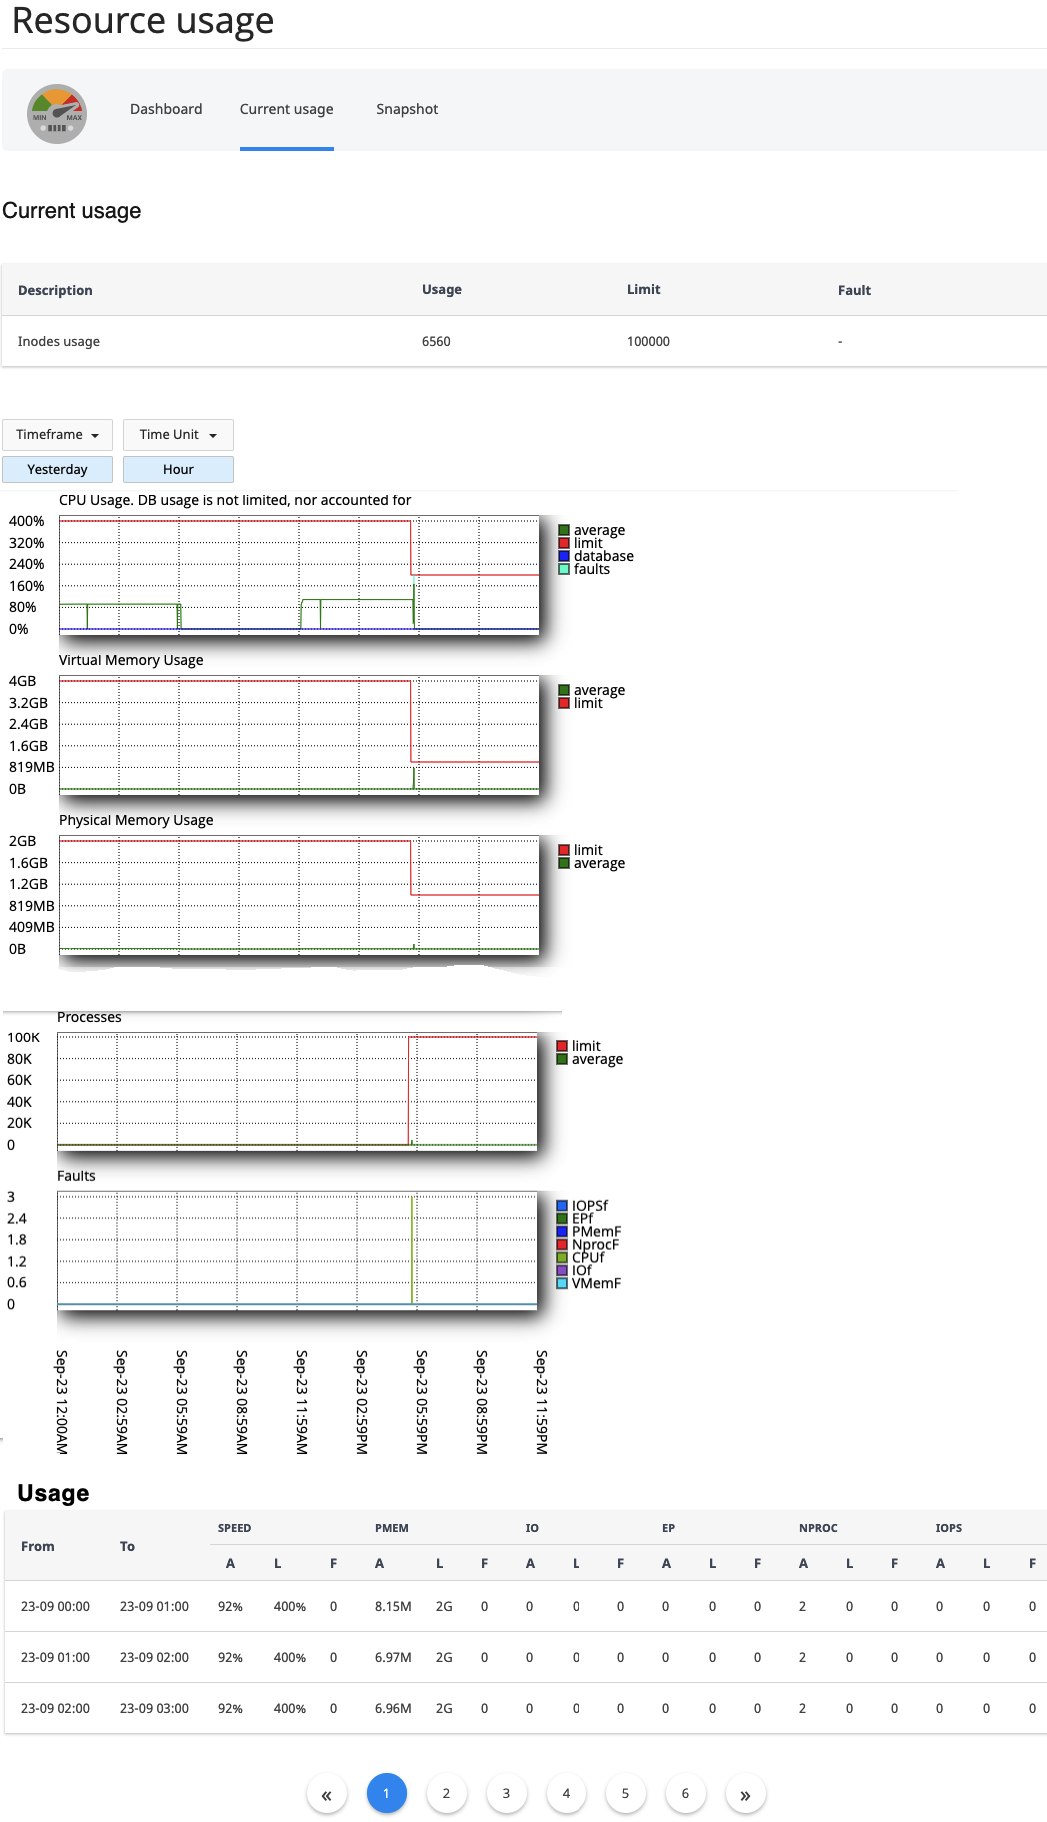
Current Usage
Go to the Current Usage tab to see the detailed information about resource usage on your server.
Note
It's possible to add the normalized_user_cpu = N value to the /etc/sysconfig/cloudlinux file. So you can see for example CPU Usage X/200 (%) in the scenario where a user's LVE CPU limit is 200%. If the value is equal to Y, CPU Usage cannot get greater than 100%.
Current Usage table
The Current Usage table displays resource usage.
Warning
Inodes usage is displayed if it is enabled and Inodes limits are set for the user. cPanel only.
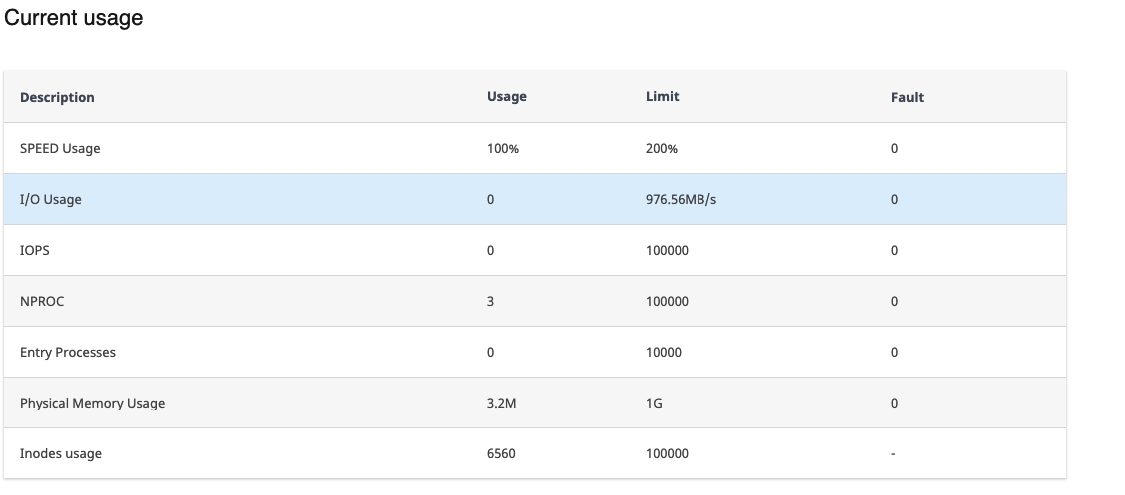
- Description: resource name
- Usage: resource usage value
- Limit: resource usage limit
- Fault: number of faults
Filters
You can filter charts and the Usage table by timeframe and time unit (day, hour, minute).
Charts
The following resources are displayed in charts:
- CPU
- Virtual Memory
- Physical Memory
- Input/Output
- Io operations
- Entry Processes
- Processes
All charts have the color legend:
- Green — average resource usage
- Red — limit set for this parameter
- Blue — database
- Green-cyan — faults (limit violations)
You can also see the Faults chart with all faults for all resources.
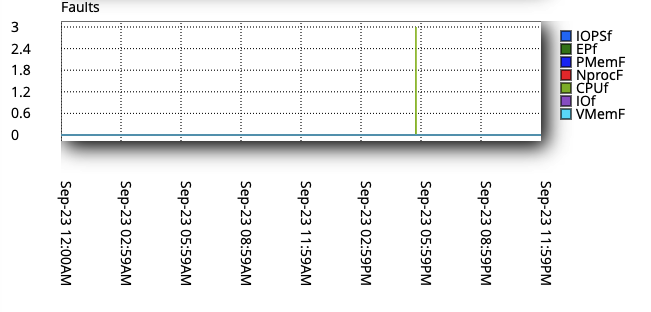
Usage
The Usage table displays information on each resource usage sorted by timeframe and time unit.
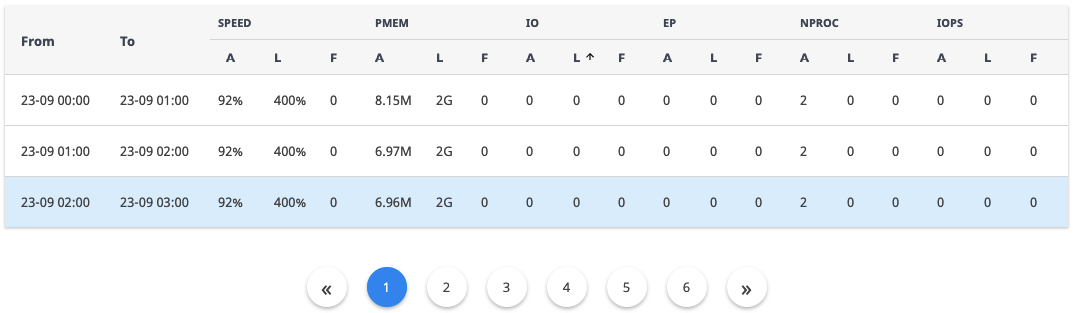
- From-To: period
- A: average
- L: limit
- F: faults
Use controls below the table to navigate through it.
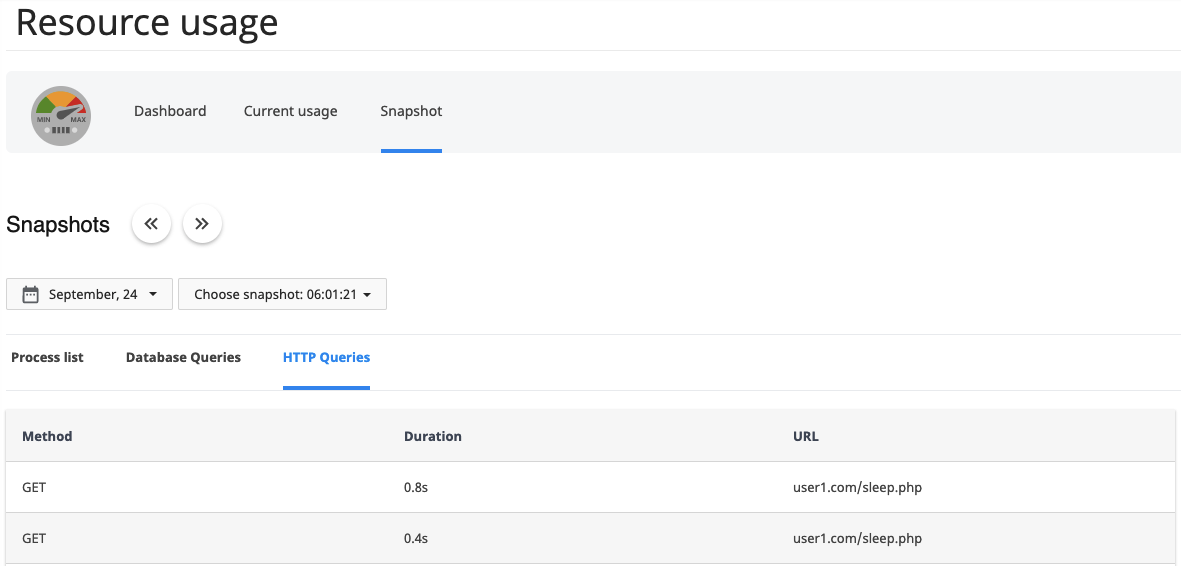
Snapshot
Go to the Snapshot tab to see server snapshots with processes list and database and HTTP queries.
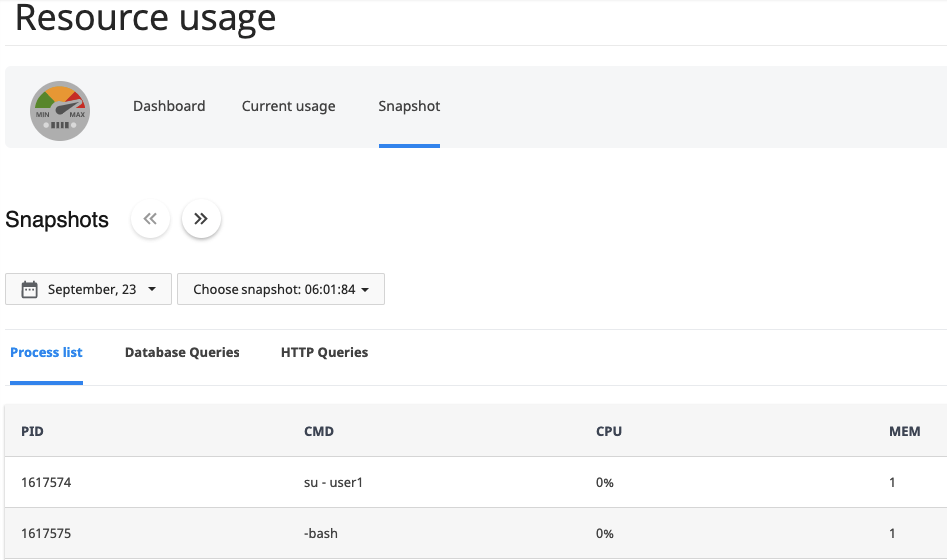
You can choose a date and a snapshot to display in the table.
Server processes snapshots
In case when a CloudLinux OS Shared user hits LVE limits, appropriate faults are generated and lvestats package generates server processes snapshot. Snapshot is a list of running applications and a list of running MySQL queries right after the faults happened.
Snapshots allow users to investigate the reason of account hitting its limits. Several snapshots are generated for each incident. An incident is a state when faults are generated in a close time period. The time period is configurable. By default, if faults are generated in 300 seconds time period, we consider them as a single incident.
The snapshot configuration options are available in
/etc/sysconfig/lvestats.config/SnapshotSaver.cfg
period_between_incidents = 300by default, time in secondssnapshots_per_minute = 2by default, maximum number of snapshots per minutemax_snapshots_per_incident = 10by default, maximum number of snapshots for an incident
To access Snapshots you can also use lve-read-snapshot utility.
Note
The list of processes in a snapshot is close but not similar to the real processes list when faults were generated. It happens because of delay when the faults are happened and the snapshot is taken by the system.
The list of MySQL queries is an output of a query:
SELECT command, time, info FROM information_schema.processlist

WHERE user = '%username';
Process list
Displays information on processes in the selected snapshot.
- PID: process ID
- CMD: what command was run
- CPU: CPU usage
- MEM: memory usage
Database queries (cPanel only)
Displays information on database queries in the selected snapshot.
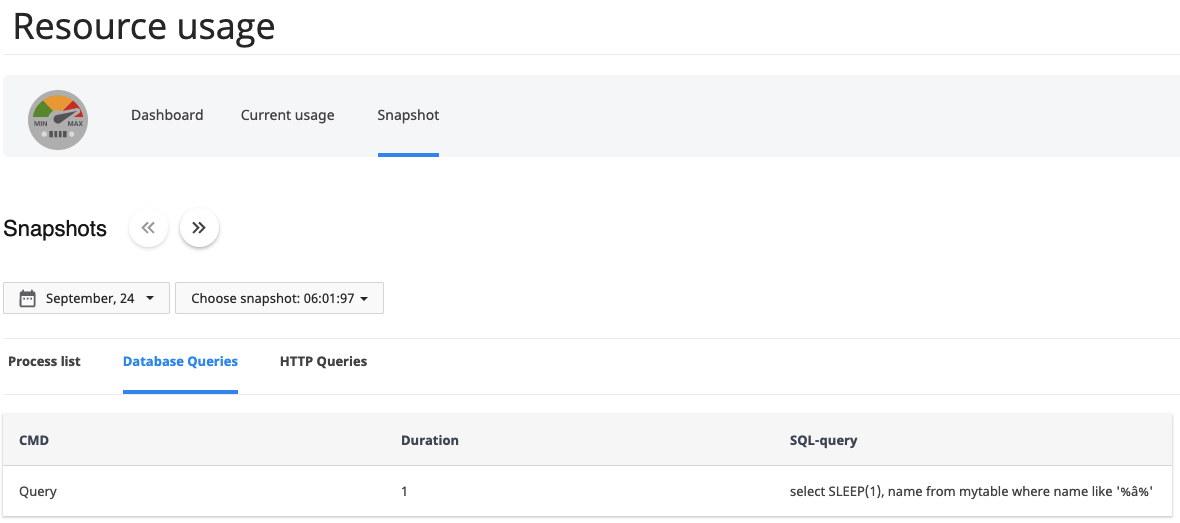
HTTP queries
Displays information on HTTP queries in the selected snapshot.
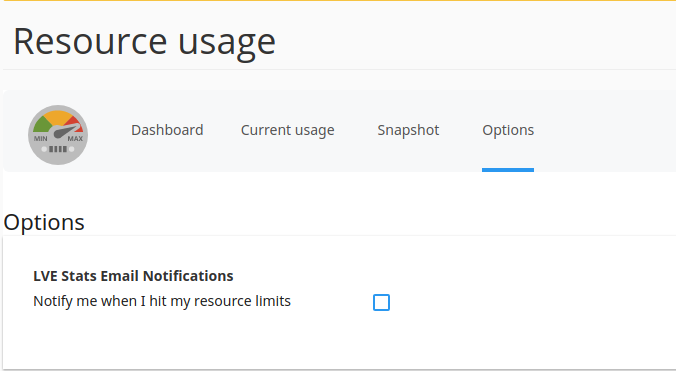
Turning On / Off email notifications per user
The following packages are required:
- lvemanager-7.3.0-1
- lve-stats-4.1.4-1
A user can disable LVE-Stats notifications about hitting LVE limits by himself.
The feature is available via Resource Usage client plugin | Options | LVE Stats Email Notifications
Python Selector client plugin
Note
Python Selector icon in end user interface is hidden when Python is disabled
End User interface allows end users to setup and manage Python for their web applications.
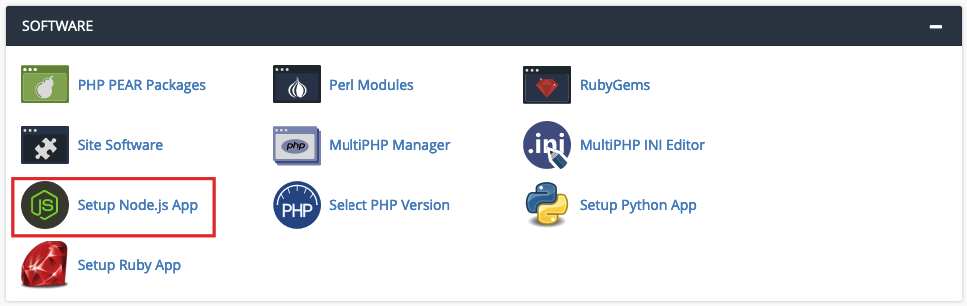
Go to cPanel → Software Section → Setup Python App.
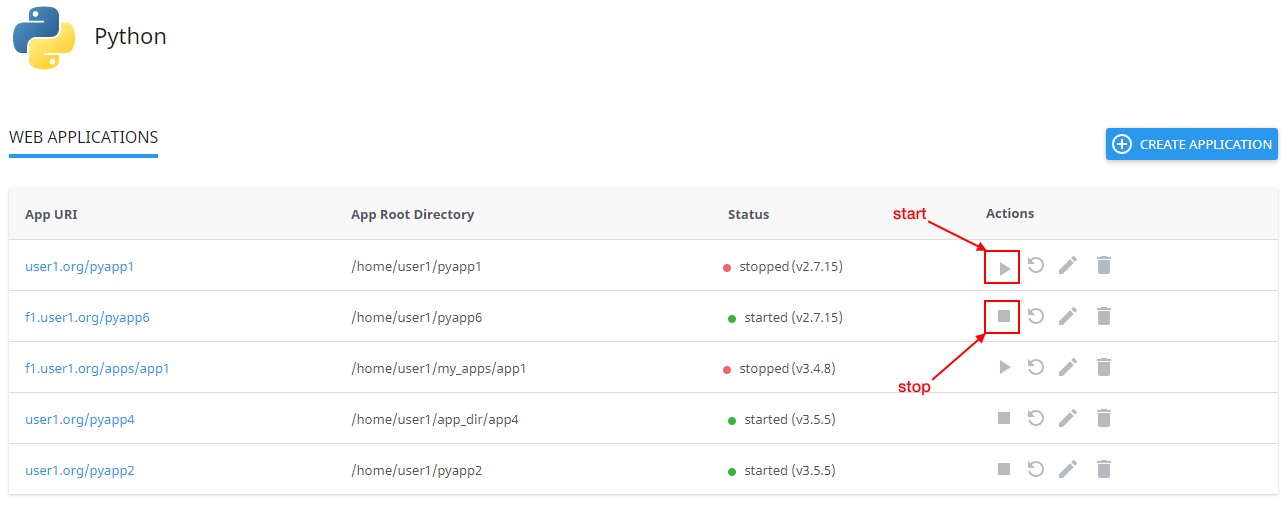
Web Applications page is displayed.
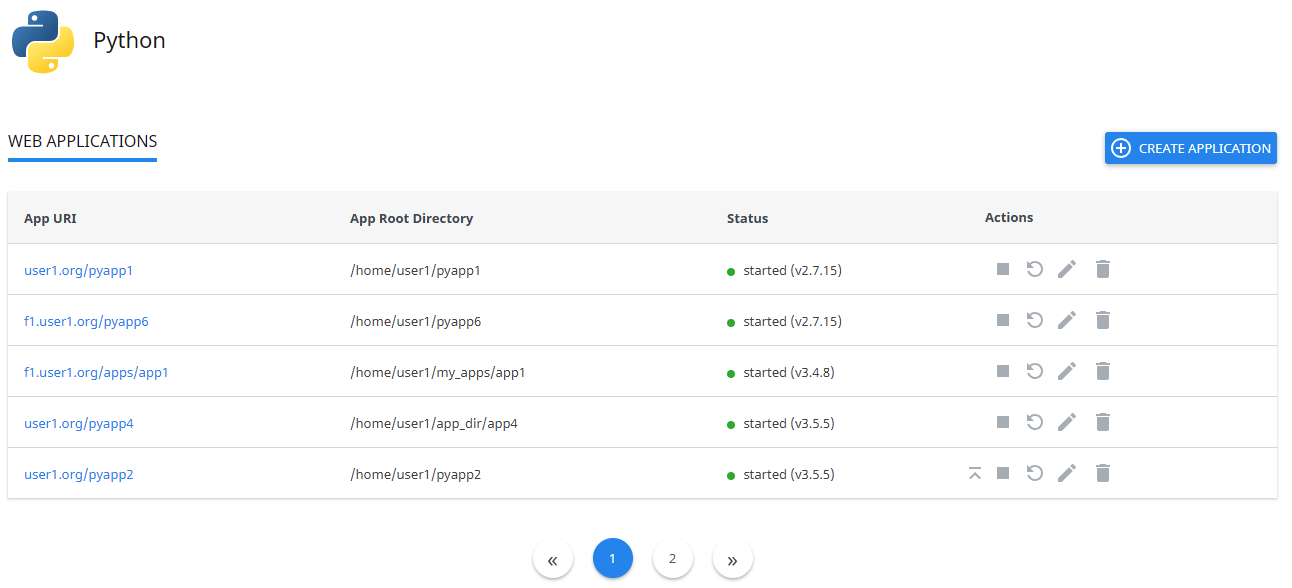
There are several columns in the list:
- App URI — application URI including the domain.
- App Root Directory — application root directory relative to user's home.
- Status — started/stopped — displays if an application is running or not and version of the application.
- Actions — allows to migrate, start, restart, stop, edit, and remove a particular application.
How to manage an application
Create application
NB! Do not use "python37", "python38", "python311" (i.e. "python{version number}") as names for your applications as this causes unexpected errors.
Click Create Application to create an application. The Create Application tab opens.
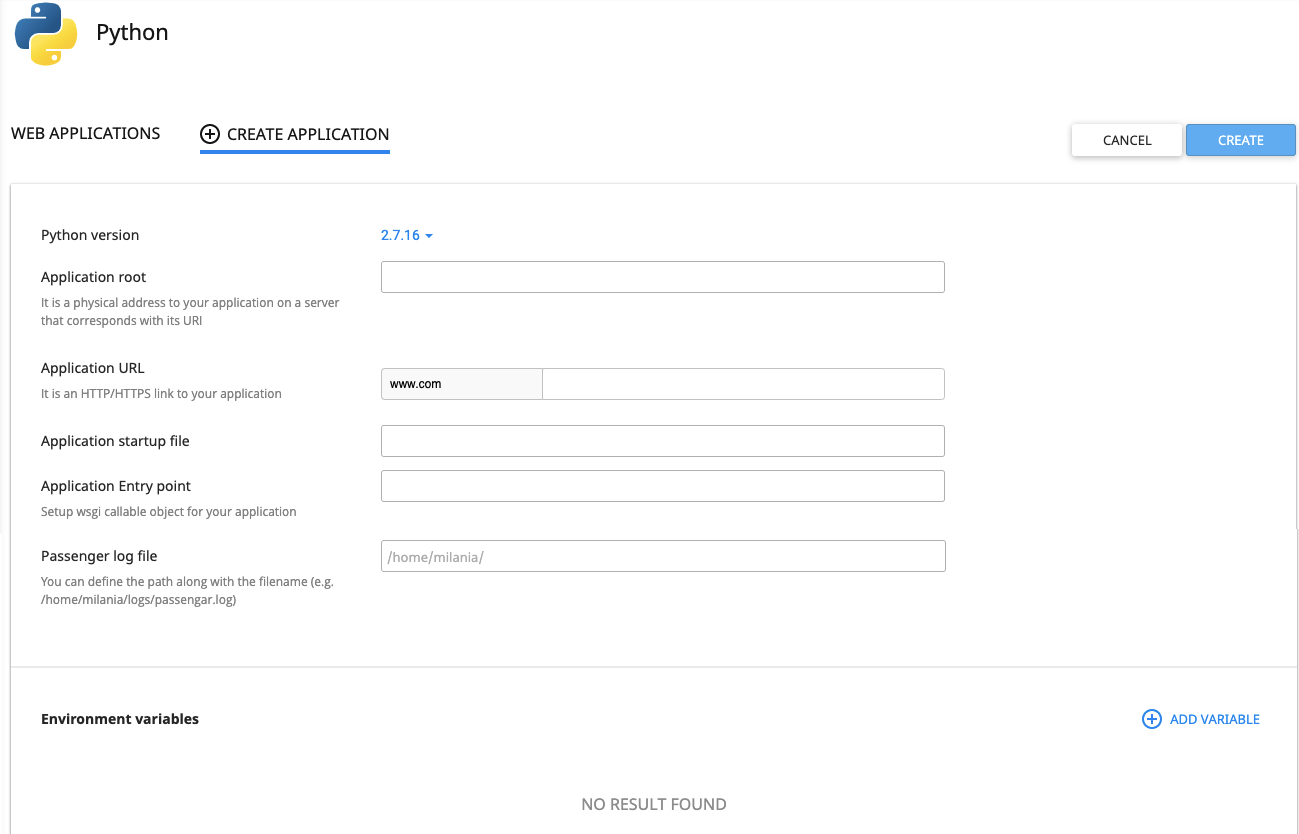
Specify the following:
- Python version — select from the dropdown (required);
- Application root — physical address to your application on a server that corresponds with its URI (required);
- Application URL — HTTP/HTTPS link to your application (optional);
- Application startup file — the file where WSGI callable object is located. It is required for application to run. Default is
passenger_wsgi.py; - Application Entry point — WSGI callable object for your application (optional). Default is
application; - Passenger log file — starting from CloudLinux Manager 5.1.0-2 you can set paths to Passenger logs for Python applications via UI (or using cloudlinux-selector utility).
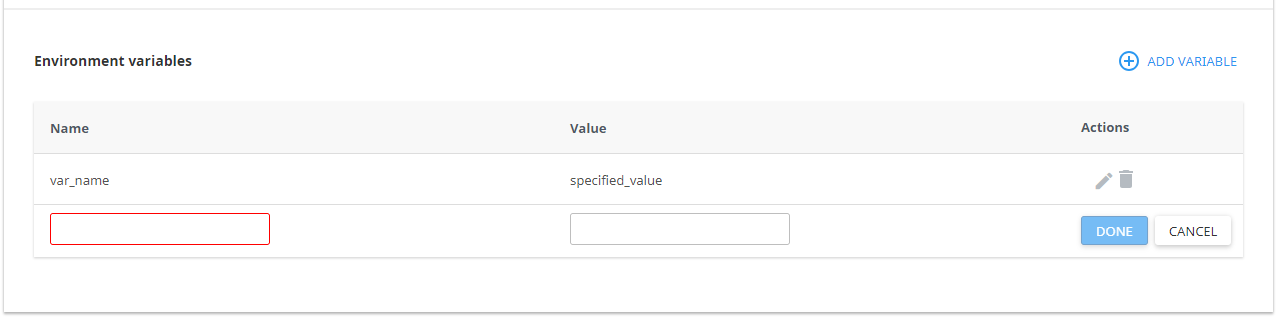
Optionally, add environment variable. To do so, click Add Variable and specify variable name and value, then click the Done or Cancel to close an adding form.
To delete or edit environment variable, click Bin or Pencil for the required variable.
Start application
To start a stopped application do the following:
- Click Start in the Actions column in a stopped application row.
- When an action is completed a Start changes to Stop.
Stop application
To stop a started application do the following:
- Click Stop icon in the Actions column in a started application row.
- When an action is completed a Stop changes to Start.
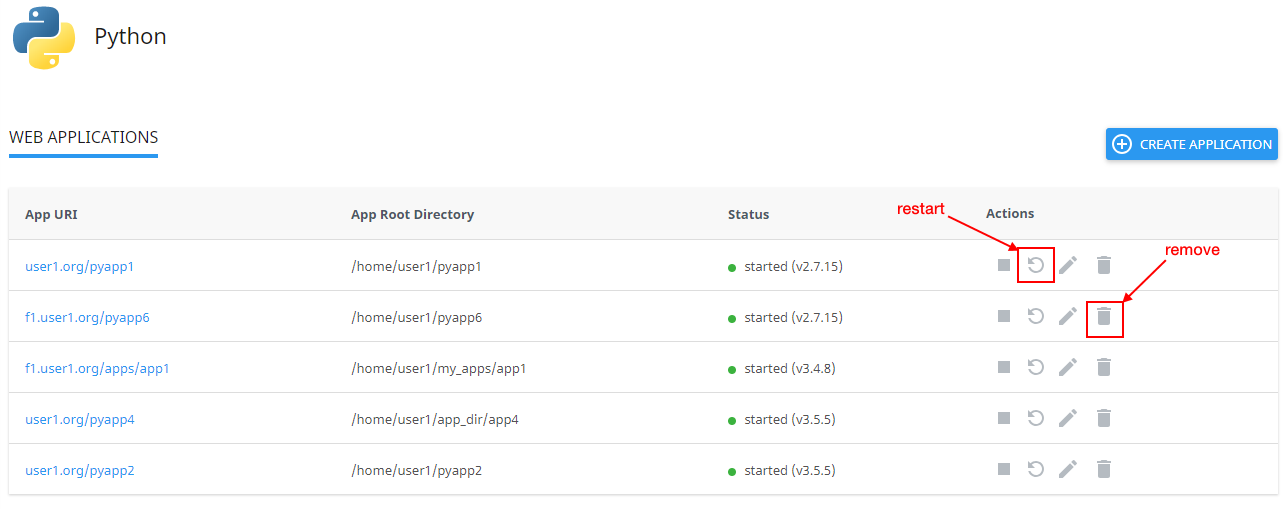
Restart application
To restart a started application do the following:
- Click Restart in the Actions column in a started application row. A current row is blocked and when a process is completed it will be unblocked.
Remove application
To remove application do the following:
- Click Bin in the Actions column in a particular application row.
- In the confirmation popup click Agree to start removing or Cancel to close the popup.
- When an action is completed an application will be removed from the Web Applications table and a confirmation popup will be displayed.
Edit application
To edit application do the following:
- Click the Pencil in the Actions column in a particular application row. A particular application tab opens.
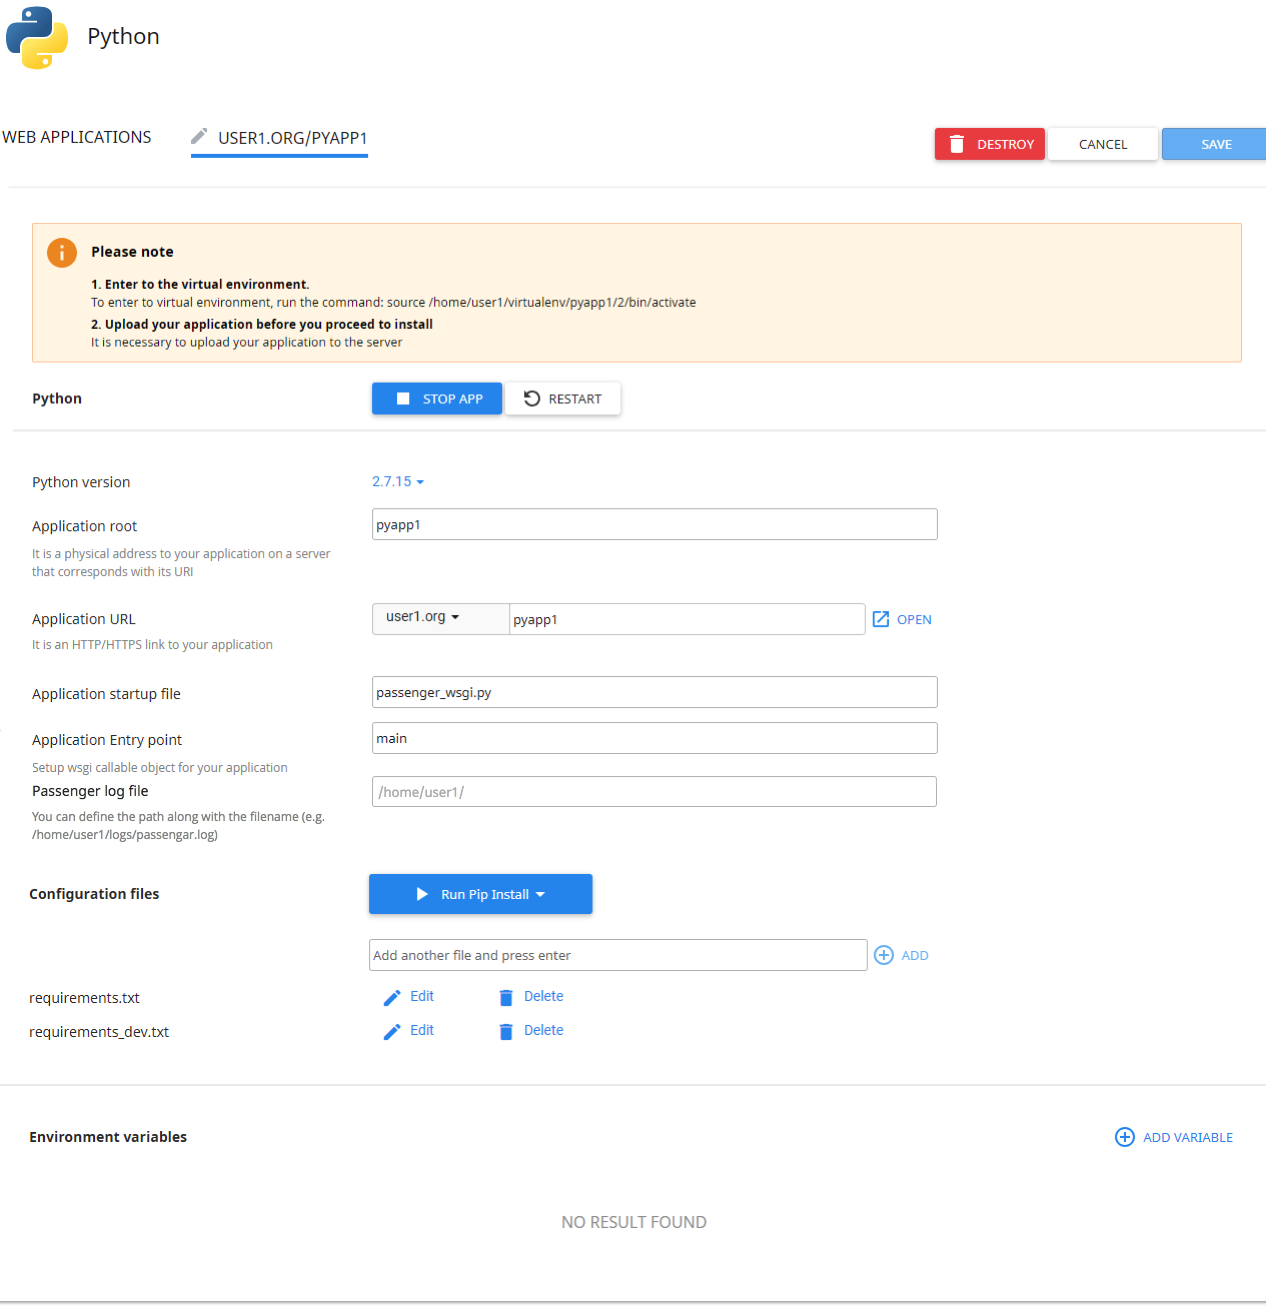
The following actions are available:
- Restart application — click Restart.
- Stop application — click Stop App.
- Remove application — click Destroy and confirm the action in a popup.
- Change Python version — choose Python version from a dropdown.
- Change Application root — specify in a field a physical address to the application on a server that corresponds with its URI.
- Change Application URL — specify in a field an HTTP/HTTPS link to the application.
- Open Application URL — click the Open.
- Change Application startup file — specify as
NAME.pyfile. - Change Application Entry point — specify WSGI callable object for your application.
- Passenger log file — starting from CloudLinux Manager 5.1.0-2 you can set paths to Passenger logs for Python applications via UI (or using cloudlinux-selector utility).
- Run pip install command — click Run pip install to install the package(s) described in the configuration file.
- Add Configuration files — click Add and specify all required information.
- Edit available configuration file — click Edit, the file opens in a new popup.
- Remove available configuration file from the list — click Remove and confirm the action or click Cancel to close the popup.
- Add Environment variables — click Add Variable and specify a name and a value.
Click Save to save all changes or Cancel to close the tab.
Migrate application
For details see How to migrate an application to the new Python Selector
Note
You can also use Python Selector CLI
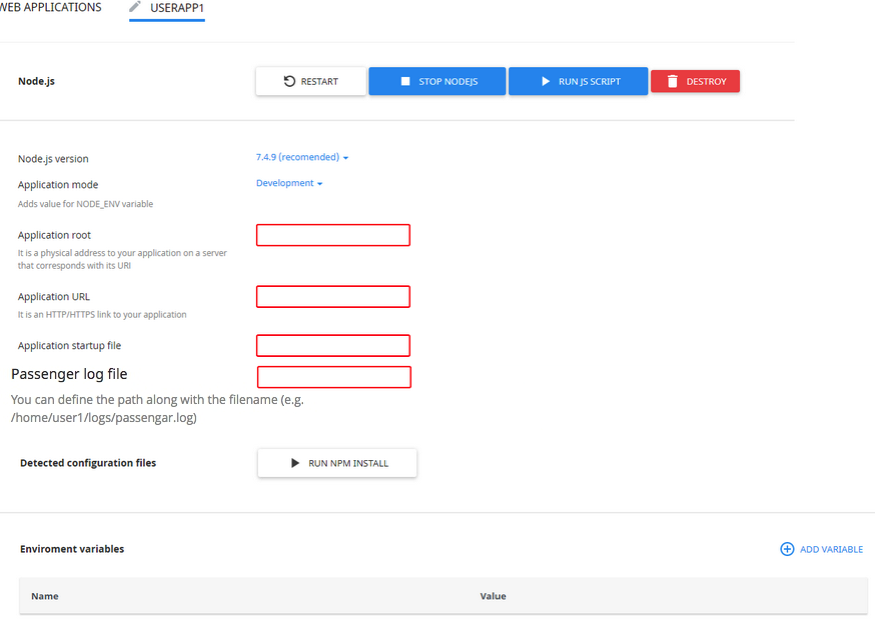
Node.js Selector client plugin
Note
Node.js Selector icon in end user interface is hidden when Node.js is disabled.
End User interface allows end users to setup and manage Node.js for their web applications.
Go to cPanel → Software Section → Setup Node.js App.
Web Applications page is displayed.
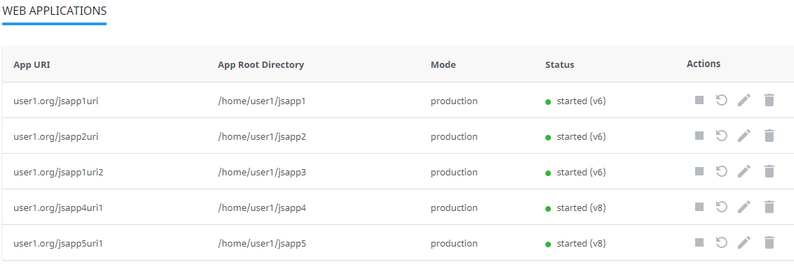
There are several columns in the list.
- App URI — application URI including the domain.
- App Root Directory — application root directory relative to user's home.
- Mode — can be production or development.
- Status — started/stopped — displays if an application is running or not and version of application.
- Actions — allows to start, restart, stop, edit, and remove a particular application.
How to manage application
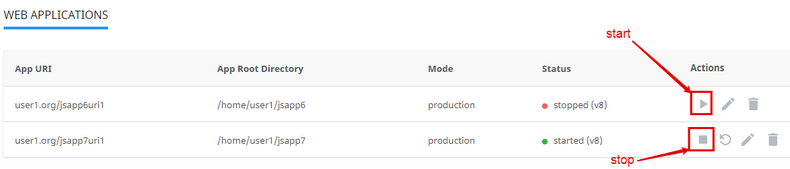
Start application
To start a stopped application do the following:
- Click Start icon in the Actions column in a stopped application row.
- When an action is completed a Start icon changes to Stop icon.
Stop application
To stop a started application do the following:
- Click Stop icon in the Actions column in a started application row.
- When an action is completed a Stop icon changes to Start icon.
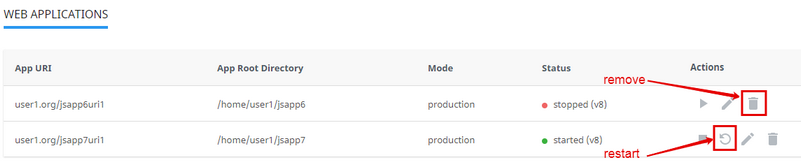
Restart application
To restart started application do the following:
- Click Restart icon in the Actions column in a started application row. A current row is blocked and when a process is completed it will be unblocked.
Remove application
To remove application do the following:
- Click Bin icon in the Actions column in a particular application row.
- In the confirmation pop-up click Agree to start removing or Cancel to close pop-up.
- When an action is completed an application will be removed from the Web Applications table and a confirmation pop-up will be displayed.
Edit application
To edit application do the following:
- Click Pencil icon in the Actions column in a particular application row. A particular application tab opens.
The following actions are available:
- Restart application — click Restart button.
- Stop Node.js — click Stop Node.js button.
- Run JavaScript script — click Run JS Script button to run a command specified in the Scripts section of the package.json file. Specify the name of the script to run plus any parameters then click Ok .
- Remove application — click Delete button and confirm the action in a pop-up.
- Change Node.js version — choose Node.js version from a drop-down.
- Change Application mode — choose application mode from a drop-down. Available modes are Production and Development .
- Application root — specify in a field a physical address to the application on a server that corresponds with its URI.
- Application URL — specify in a field an HTTP/HTTPS link to the application.
- Application startup file — specify as NAME.js file .
- Passenger log file — starting from CloudLinux Manager 5.1.0-2 you can set paths to Passenger logs for Node.js applications via UI (or using cloudlinux-selector utility).
- Run npm install command — click Run npm install button to install the package(s) described in the package.json file.
- Add Environment variables — click Add Variable and specify a name and a value.
Note
You can also use Node.js Selector CLI
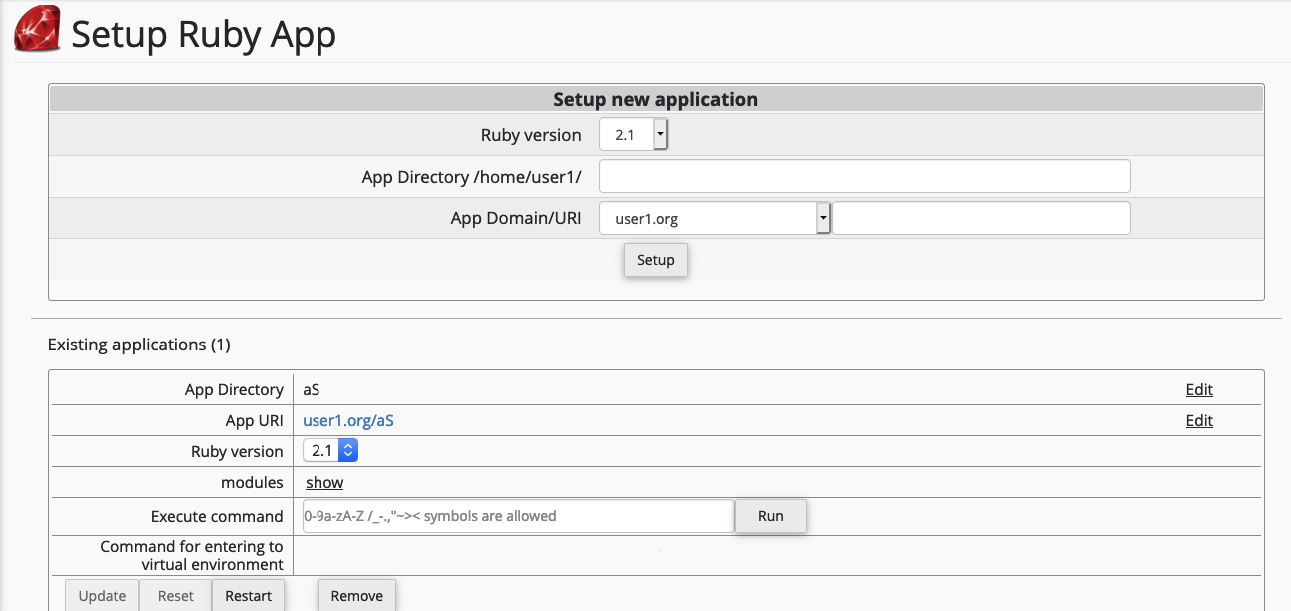
Ruby Selector client plugin
End user interface allows end users to setup and manage Ruby for their web applications.
Go to cPanel → Software Section → Setup Ruby App.
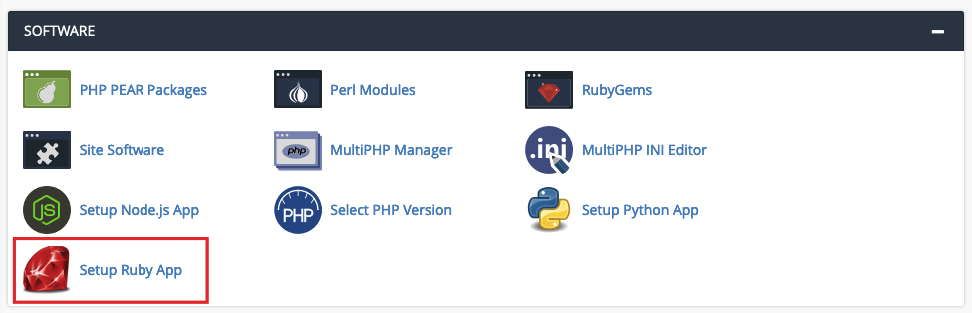
Setup Ruby application page is displayed.
Here you can do the following:
- Setup a new application.
- View/edit/restart/remove the existing application.
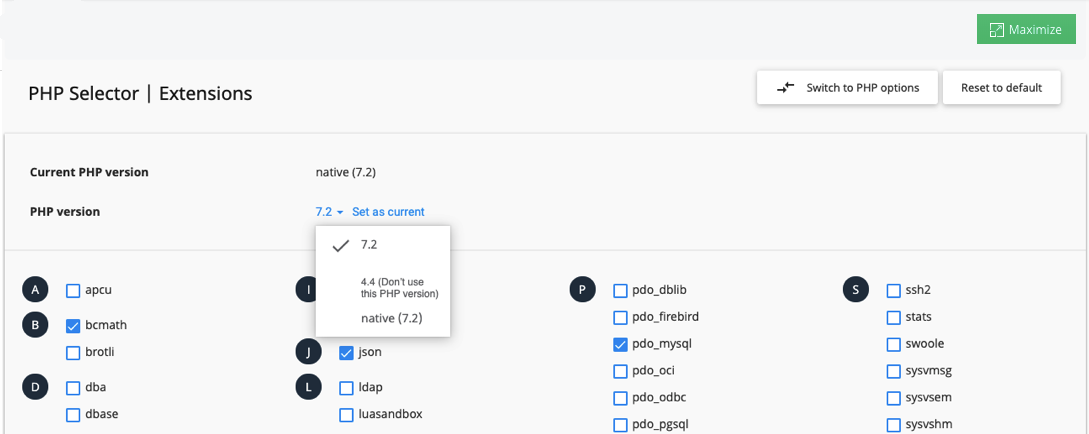
PHP Selector client plugin
End user interface allows end users to select and manage PHP extensions and options for the particular PHP version.
Go to cPanel → Software Section → Select PHP Version.
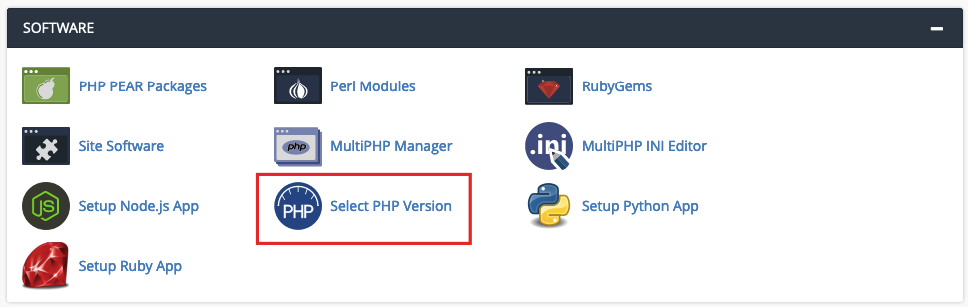
PHP Extensions page opens.
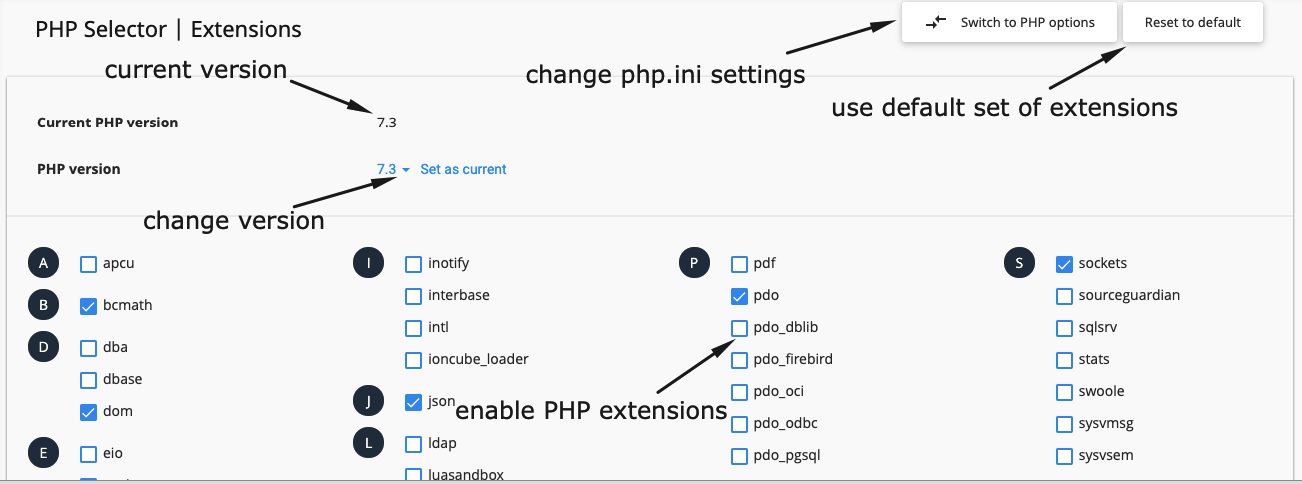
Here you can choose extensions for the particular PHP version, the current PHP version and reset to default.
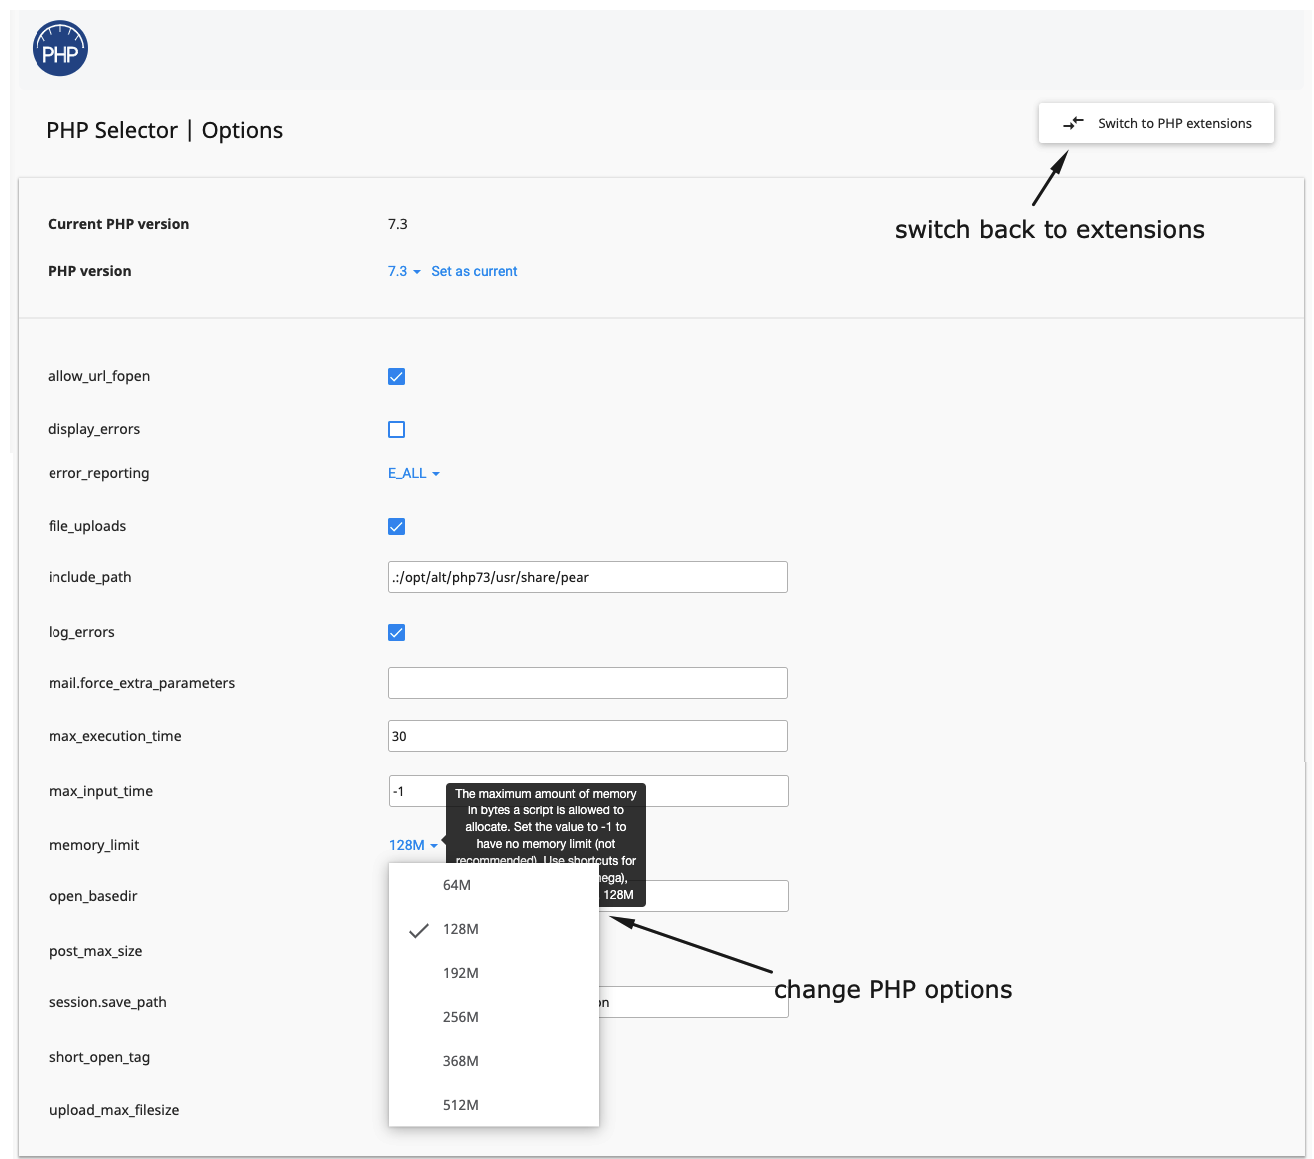
To manage PHP options, click Switch to PHP options.
All changes are saved automatically.
allow_url_fopen. Allows PHP file functions to retrieve data from remote locations over FTP or HTTP. This option is a great security risk, thus do not turn it on without necessity.display_errors. Determines whether errors should be printed to the screen as part of the output or if they should not be shown to a user.error_reporting. The error reporting level.file_uploads. Allows uploading files over HTTP.include_path. The list of directories where scripts look for files (similar to system's PATH variable). To separate directories, use a colon (:) For example:.:/dir/inc:/usr/lib/phplog_errors. Tells whether to log errors. By default, errors are logged in the server's error log. Use the error_log directive to specify the path to your own log file.mail.force_extra_parameters. Additional parameters for the mail() function used to send mail. For example, to use your custom Sendmail configuration:-C /dir/conf.cfmax_execution_time. The maximum time in seconds a script is allowed to run before it is terminated.max_input_time. The maximum time in seconds a script is allowed to parse input data.memory_limit. The maximum amount of memory in bytes a script is allowed to allocate. Set the value to -1 to have no memory limit (not recommended). Use shortcuts for byte values: K (kilo), M (mega), and G (giga). For example, 128M.open_basedir. The list of directories used to limit the files that can be opened by PHP. If the file is outside the specified directories, PHP scripts will refuse to open it. To separate directories, use a colon. For example:/dir/upload:/usr/tmp.post_max_size. The maximum size in bytes of data that can be posted with the POST method. Typically, should be larger thanupload_max_filesizeand smaller thanmemory_limit. Use shortcuts for byte values: K (kilo), M (mega), and G (giga). For example, 16M.session.save_path. The directory where PHP writes session data (files). For example:/dir/tmpshort_open_tag. Allows the short form of the PHP open tag.upload_max_filesize. The maximum size in bytes of an uploaded file. Use shortcuts for byte values: K (kilo), M (mega), and G (giga). For example, 128M.
PHP Selector. My Domains tab
The My Domains tab contains a list of user’s domains to visualize which PHP Selector is used by domain.
A user can configure a domain to use CloudLinux OS Shared PHP Selector.
- Click Use PHP Selector

- Set a version in PHP Selector

Note
If php-fpm is enabled for a domain the only administrator can set it to disable.
CloudLinux Manager options
You can change CloudLinux Manager settings for a server manually via cPanel/WHM or, if you have many servers, you can change CloudLinux Manager settings for them in the config file.
Changing settings manually
- Log in to cPanel, go to WHM, choose CloudLinux OS Shared and click Options.
- Change settings.
Changing settings in the config file
You can modify the following options in the config file /var/cpanel/cpanel.config directly for example via Puppet.
lve_hideextensions | Hides (when =1) range of php extensions for user in Select PHP version |
lve_hideuserstat | Hides (when =1) LVE statistics in cPanel Stats Bar (UI) |
lve_showinodeusage | Displays (when =1) used inodes in cPanel (UI) |
lve_hide_selector | Turns off UI PHP Selector (Select PHP Version option) |
lve_enablerubyapp | Displays (when =1) Ruby Selector in user’s interface (UI) |
Note
It is not allowed to change lve_enablepythonapp option in the config file directly.
You can use cloudlinux-selector utility to change lve_enablepythonapp option:
cloudlinux-selector set --json --interpreter=python --selector-status=enabled
Or you can change it via WHM -> CloudLinux Manager -> Options -> Python Selector -> Python
After modifying the config files directly, you should execute the following command to apply changes:
/usr/share/l.v.e-manager/utils/dynamicui.py --sync-conf=all
cPanel LVE Extension
Note
CloudLinux Manager 1.0-9.8+
cPanel LVE Extension allows to control LVE limits for packages via cPanel hosting packages control interface and via cPanel WHM API . It simplifies integration with existing billing systems for cPanel (like WHMCS for example).
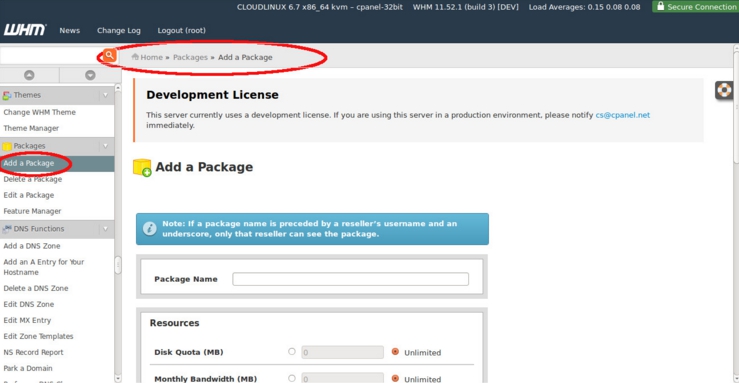
Add Package Extension
To add LVE Settings to standard cPanel package, go to Packages | Add a Package.
Note
You can find the information on how to add a package in official cPanel documentation on the link: https://documentation.cpanel.net/display/ALD/Add+a+Package
Tick LVE Settings in the bottom of the page to open LVE Settings form.
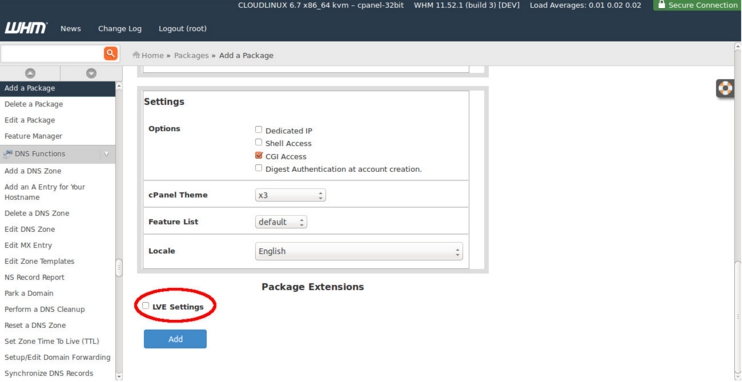
You can specify the following options:
Note
Your changes to LVE Settings will appear in the system after a little while.
| Speed Settings | Maximum CPU usage for an account. Must be in the range 1 - 100 (but obligatory > 0 ) if old format is used; use % or Mhz\Ghz to set CPU limit as speed; Type DEFAULT to use default value. |
| Memory Settings | Pmem - Maximum physical memory usage for an account. Vmem - Maximum virtual memory usage for an account. Must be a positive number. Postfix allowed only in KGMT. Type DEFAULT to use default value. Type 0 for unlimited resource. |
| Max entry proc Settings | Maximum number of entry processes (concurrent connections) for an account. Must be a positive number. Type DEFAULT to use default value. Type 0 for unlimited resource. |
| Nproc Settings | Maximum number of processes usage for an account. Must be a positive number. Type DEFAULT to use default value. Type 0 for unlimited resource. |
| IO Settings | Maximum I/O (input/output) usage speed for an account. Is measured in Kb/s. Must be a positive number. Type DEFAULT to use default value. Type 0 for unlimited resource. |
| IOPS Settings | Maximum IOPS (input/output operations per second) usage for an account. Must be a positive number. Type DEFAULT to use default value. Type 0 to unlimited resource. |
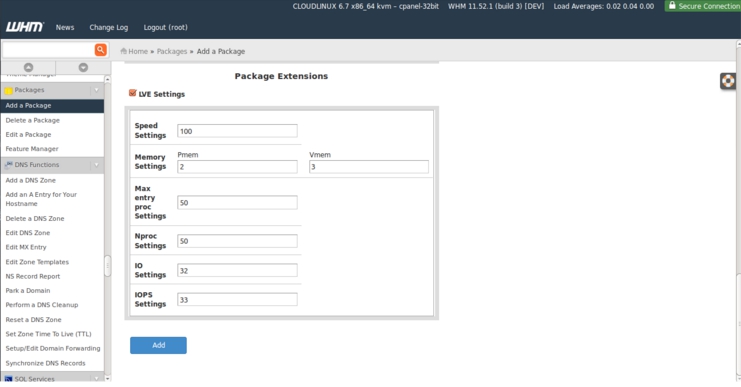
Click Add to apply your changes.
Edit Package Extensions
You can edit limits in any convenient for you way - in Edit a Package section, in the CloudLinux Manager or even via WHM API.
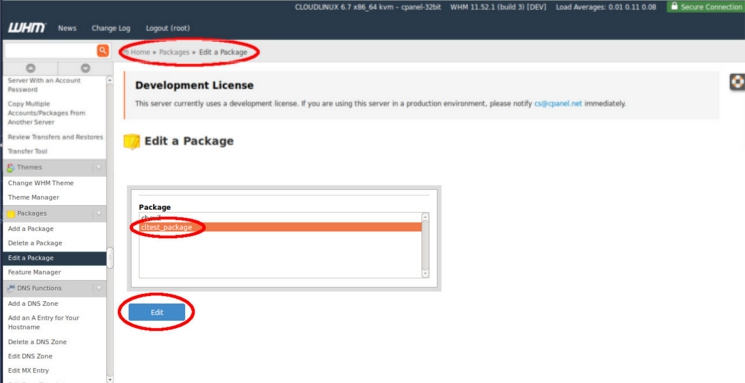
Edit a Package
To edit package extensions, go to Packages | Edit a Package. Choose a package from the Package list and click Edit.
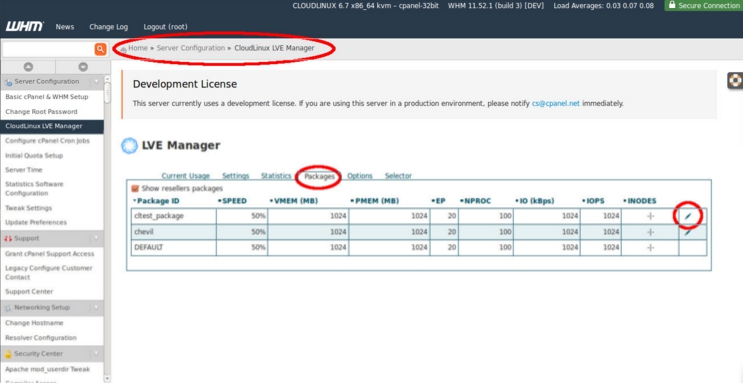
CloudLinux Manager
To edit package extensions, go to CloudLinux Manager | Server Configuration | CloudLinux OS Shared CloudLinux Manager | Packages and click pencil (edit) icon.
WHM API
To learn how to work with package extensions limits using WHM API, please read the official cPanel documentation: https://documentation.cpanel.net/display/SDK/Guide+to+Package+Extensions+-+Data+Behavior+and+Changes
Control panel integration guide
Here you will find the instructions and common techniques used to integrate your software with CloudLinux OS Shared.